

Question
I need help understanding the formulas. I have to complete the spreadsheet below by filling in the correct formulas into the cells that are green.
I need help understanding the formulas. I have to complete the spreadsheet below by filling in the correct formulas into the cells that are green. An image of the Excel item is at the bottom.
This assignment will enable you to use EXCEL functions to perform calculations associated with selecting projects based on various factors and criteria, some or all of which could be financial measures like net present value, internal rate of return, payback period, etc. You will need to understand the examples on the left of the Week 3 IA_Student spreadsheet attached below, particularly how the EXCEL functions are used. Once you have understood those examples, your assignment requires that you use the same EXCEL functions to complete the examples on the right of the spreadsheet (by filling the green cells). Once you have completed the examples on the right of the spreadsheet, submit ONLY the completed EXCEL spreadsheet to your assignment folder.
WEEK 3 INDIVIDUAL ASSIGNMENT
Project management knowledge draws from various disciplines, one of which is finance and accounting. In this assignment, we will introduce some widely used financial concepts at a high level, without getting into the detailed math and computations associated with them. If you are curious to learn more about these concepts, there is a lot of information on the web. One good source of information on financial terms and concepts is Investopedia's financial dictionary at https://www.investopedia.com/financial-term-dictionary-4769738.
For the purposes of this assignment, you only need to have a high-level appreciation and understanding of some key financial concepts (and associated metrics) and know how to use EXCEL functions to compute those metrics. These financial concepts and metrics come in useful during project selection and some of them are also used during project execution (when tracking the value which projects create). For example, if an organization has to choose no more than five projects from fifteen competing projects, how should it decide which five to work on? Several considerations can influence the selection of these five: financial, strategic, resource/talent availability, etc., or some combination of these.
When there are combinations of these selection criteria, a weighted scoring model can be used. The weights correspond to the perceived importance of each selection factor and the scores are measures of how well each option stacks up against each selection factor. For example, suppose a company has two projects A and B and we have two selection factors: profitability and social impact.
Selection Factor | Weight | Project A scores | Project B scores |
Profitability | 60 | 90 | 70 |
Social Impact | 40 | 20 | 60 |
Composite scores | 6200 | 6600 |
The Weight column shows how important each factor is to the company. In this case, Profitability has a weight of 60 which is more that the weight of Social Impact, so Profitability is about 50% more important to the company than is Social Impact (because = 1.5 = 150%). Note that in this case the weights add up to 100 (60 + 40 = 100), but it is perfectly fine if they do not add up to 100. The last two columns show how each of the two projects stack up on the Profitability and Social Impact scales. Project A is more profitable than Project B (because its score of 90 is higher than Project B's score of 70) and, similarly, Project B is much higher (by a factor of 3 = 60/20) on the Social Impact scale. We then calculate a composite score for Project A as follows: 90 x 60 + 20 x 40 = 5400 + 800 = 6200. Likewise, the composite score for Project B is 70 x 60 + 60 x 40 = 4200 + 2400 = 6600. Since the composite score of Project B is higher than the composite score of Project A, we would infer that based solely on the two selection factors and the associated weights and scores, Project B must be selected over Project A.
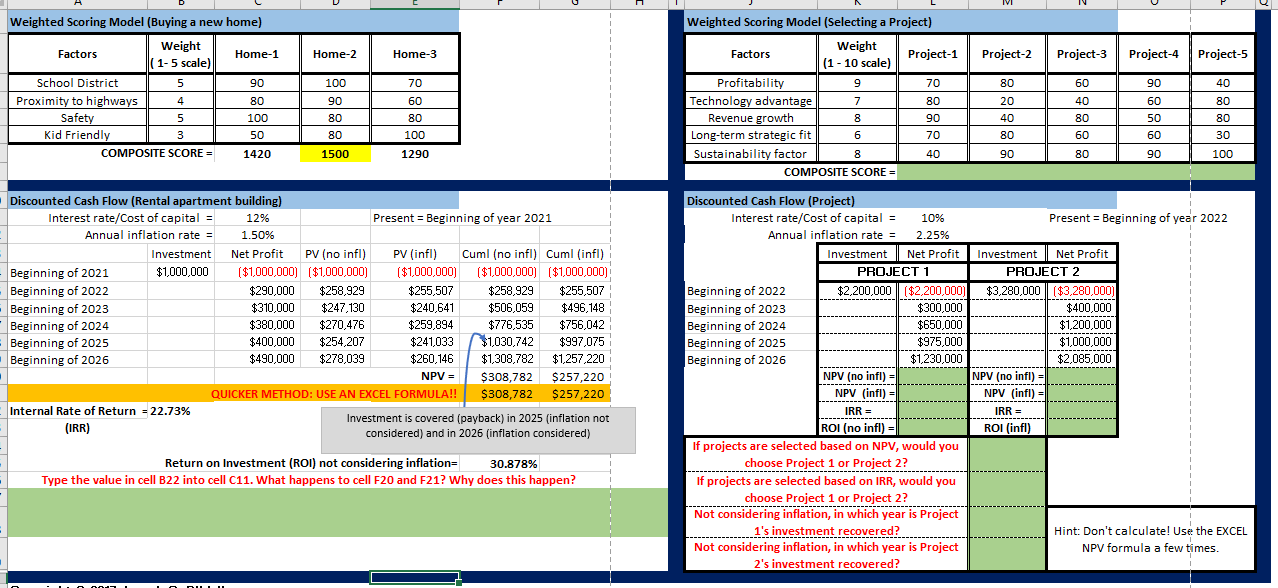
Of course, there could be several selection factors (not just two) when making such selection decisions. Scores can sometimes be shown as percentages (90% instead of 90) but that does not change the outcome. Composite scores can be calculated or "automated" in EXCEL using the SUMPRODUCT function. The attached EXCEL file has two sets of examples. On the left are examples that are fully worked out for you, so that you can see which EXCEL function is used (and how the function is used). On the right, are similar exercises for you to complete by using the same functions shown on the left. The topmost example is one that uses weighted scoring. The cells in GREEN are ones you should fill out. You will need to use the same EXCEL functions used on the left.
The examples below the weighted scoring model example in the spreadsheet demonstrate various financial metrics that can also be used, individually or in combination, to select projects: discounted cash flow (DCF), present value (PV)et present value (NPV), internal rate of return (IRR), payback period, and return on investment (ROI). There are other financial metrics but these ones are most frequently used in project selection. When used in combination, these metrics may become part of a weighted scoring model selection scheme.
You can learn more about these metrics by researching them on the web or from the Investopedia link above. However, even an intuitive and high-level understanding of these metrics can often suffice for a project manager who has access to tools like EXCEL that perform all the gory calculations behind the scenes. For the purpose of this exercise, it is adequate if you know how to use EXCEL to arrive at the values of the metrics - you do not need to understand how exactly the computations are done. The following level of intuitive understanding should be ample to appreciate these metrics:
- Present value (PV) and net present value (NPV): These factor in the time value of money, meaning that money compounds in value as time progresses. If you have a savings account, you would not be surprised if the $1,000 which you deposit today grows to $1,025 four years later. This happens because of compound interest. You could say that $1,000 today is worth $1,025 fours later OR that $1,025 four years from now is worth $1,000 today. The way this is phrased in finance is that the present value (meaning the value today) of $1,025 four years from now is $1,000. In other words, present value estimates how much a future cash amount is worth today. The net present value is simply the present value minus the costs. To calculate PV and NPV, you need to know the interest rate (sometimes called the cost of capital) and then invoke the EXCEL NPV function.
- Discounted cash flow (DCF): This requires calculating PV of future cash flows. The Discounted Cash Flow example at the left of the spreadsheet is associated with buying a rental building. Your investment in acquiring the building at the start of 2021 is $1,000,000. Once you acquire it, you rent it out and have a net profit each year which would be the total of rent received minus any building maintenance and management costs, real estate taxes, etc. (column C). The numbers in columns D, E, F, and G show the traditional calculations (without using the EXCEL functions). (Cuml indicates cumulative present value.) Column F does not factor in inflation, and column G does factor in inflation. Row 20 shows the NPV resulting from the values in rows 14 - 19 of columns D,E, F, and G. Row 21 demonstrates the magic of using EXCEL functions: we got the same NPV numbers using the EXCEL NPV function!! In other words, if we were smart, we really did not need to compute the values in rows 14 - 19 of columns D, E, F, and G!! So, your job is now to use the NPV function in the example on the right (discounted cash flow for a project).
- Internal rate of return (IRR): This is a measure of the attractiveness of an investment and it is essentially an annualized "interest rate". The larger that interest rate, the more attractive the investment. Formally defined, the IRR is the interest rate which makes the NPV zero. Verify this by following the instructions in row 26. (Typing in the exact string =B22 into cell C11 is the best way to verify this.) Note how we used the EXCEL IRR function to compute the IRR in cell B22, and then use the same function for the example on the right.
- Return on investment (ROI): This is a very simple notion and is easy to compute which is why there is no EXCEL function for this. Here is an example. Suppose you bought a stock for $100 and sold it for $105. You gained $105 - $100 = $5. When you convert the $5 to a percentage of the original cost of $100, you get the ROI. So, in this case your ROI is $5 divided by $100, which is 5%. Obviously, the higher the ROI the better.
- Payback period: This is also a simple notion and represents the time period over which you recover your investment. If you buy a bicycle for $200 and rent it out for $5 per day, you will need 200/5 = 40 days to recover your original investment of $200 (assuming you rent the bicycle every day and you disregard the time value of money). For the example on the left of the spreadsheet, note that in the no-inflation case your payback occurs in 2025 (first year that your cumulative PV exceeds the initial $1,000,000 investment) and that the payback occurs in 2026 if you do factor in inflation. There is no EXCEL function for directly calculating the payback period but you can use the NPV function a few times to figure it out. Use the NPV function for the first two years, then the first three years, then first four years, etc. and when you reach a positive NPV it means that your payback occurs in that year (meaning that you have recovered your initial investment). That is how you should calculate the investment recovery period for the example on the right.
Once again, your assignment requires you to fill in the green cells in the spreadsheet by using EXCEL functions used in the examples on the left of the spreadsheet. This will require that you carefully look at the functions used on the left and understand how they are used, and then just literally mimic that usage on the right.
Step by Step Solution
There are 3 Steps involved in it
Step: 1

Get Instant Access to Expert-Tailored Solutions
See step-by-step solutions with expert insights and AI powered tools for academic success
Step: 2

Step: 3
Ace Your Homework with AI
Get the answers you need in no time with our AI-driven, step-by-step assistance
Get Started
Understanding Management
Authors: Richard L Daft, Dorothy Marcic
6th Edition
9780324581782, 324581785, 978-0324568387