

Answered step by step
Verified Expert Solution
Question
1 Approved Answer
I need help with 6 and 7 specifically what's written in the 1st photo and generally with what's not written in the photo How do
I need help with 6 and 7 specifically what's written in the 1st photo and generally with what's not written in the photo
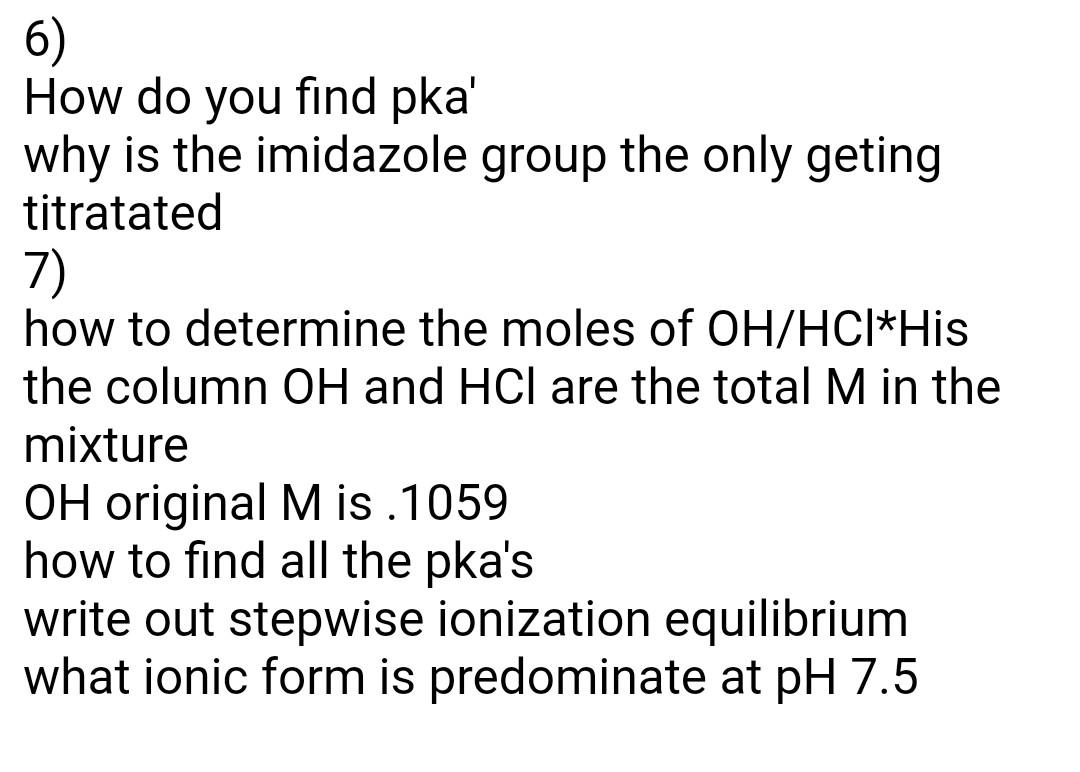
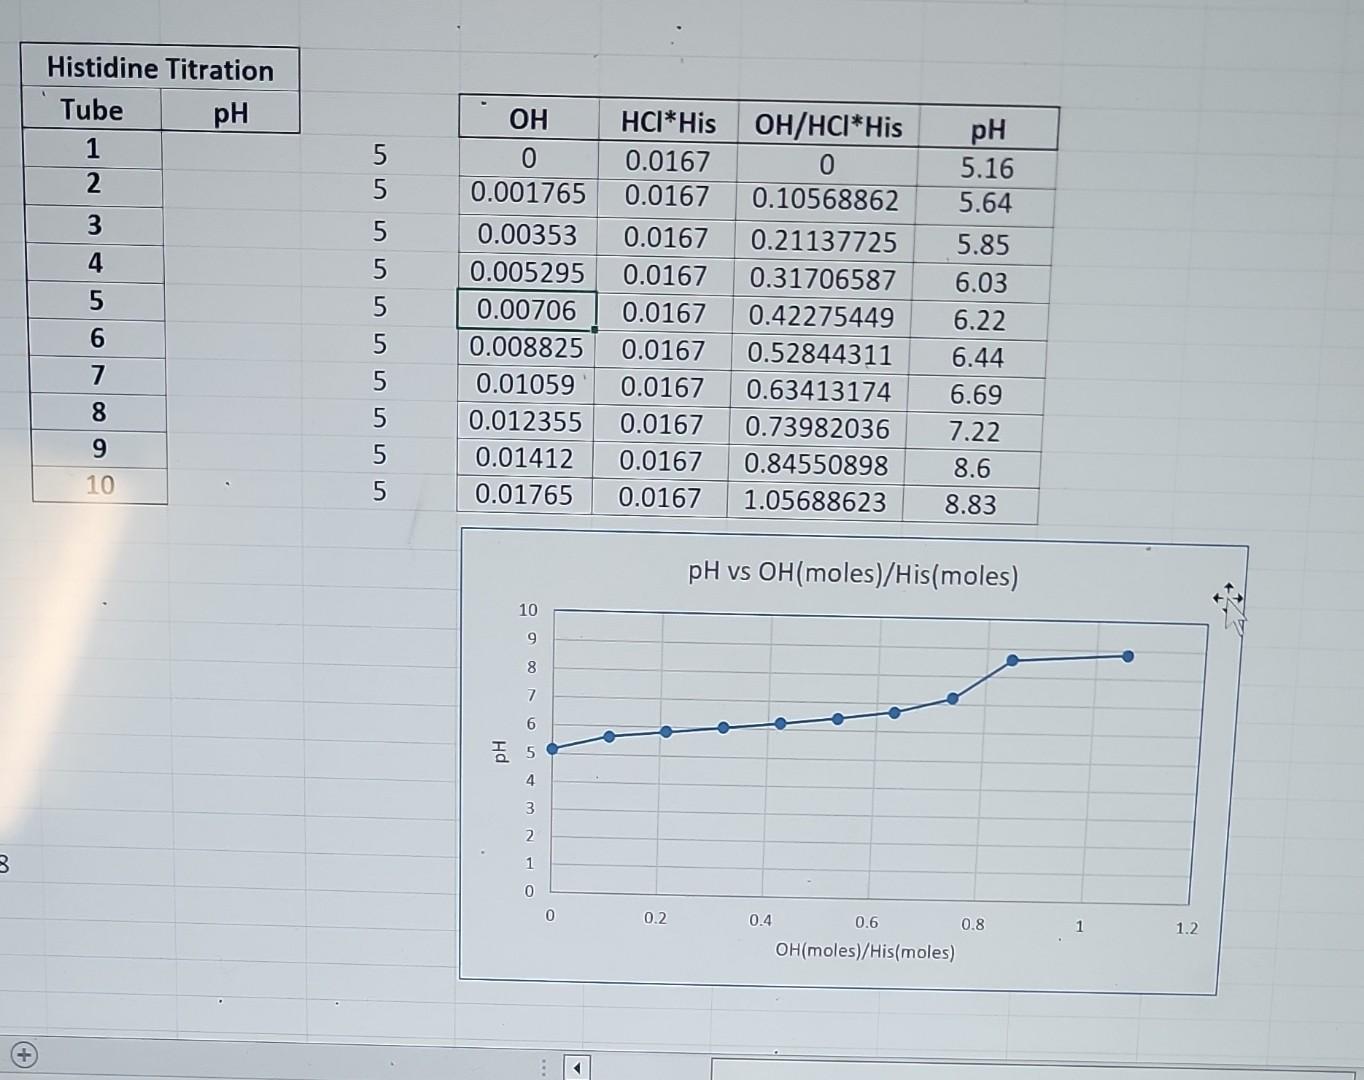
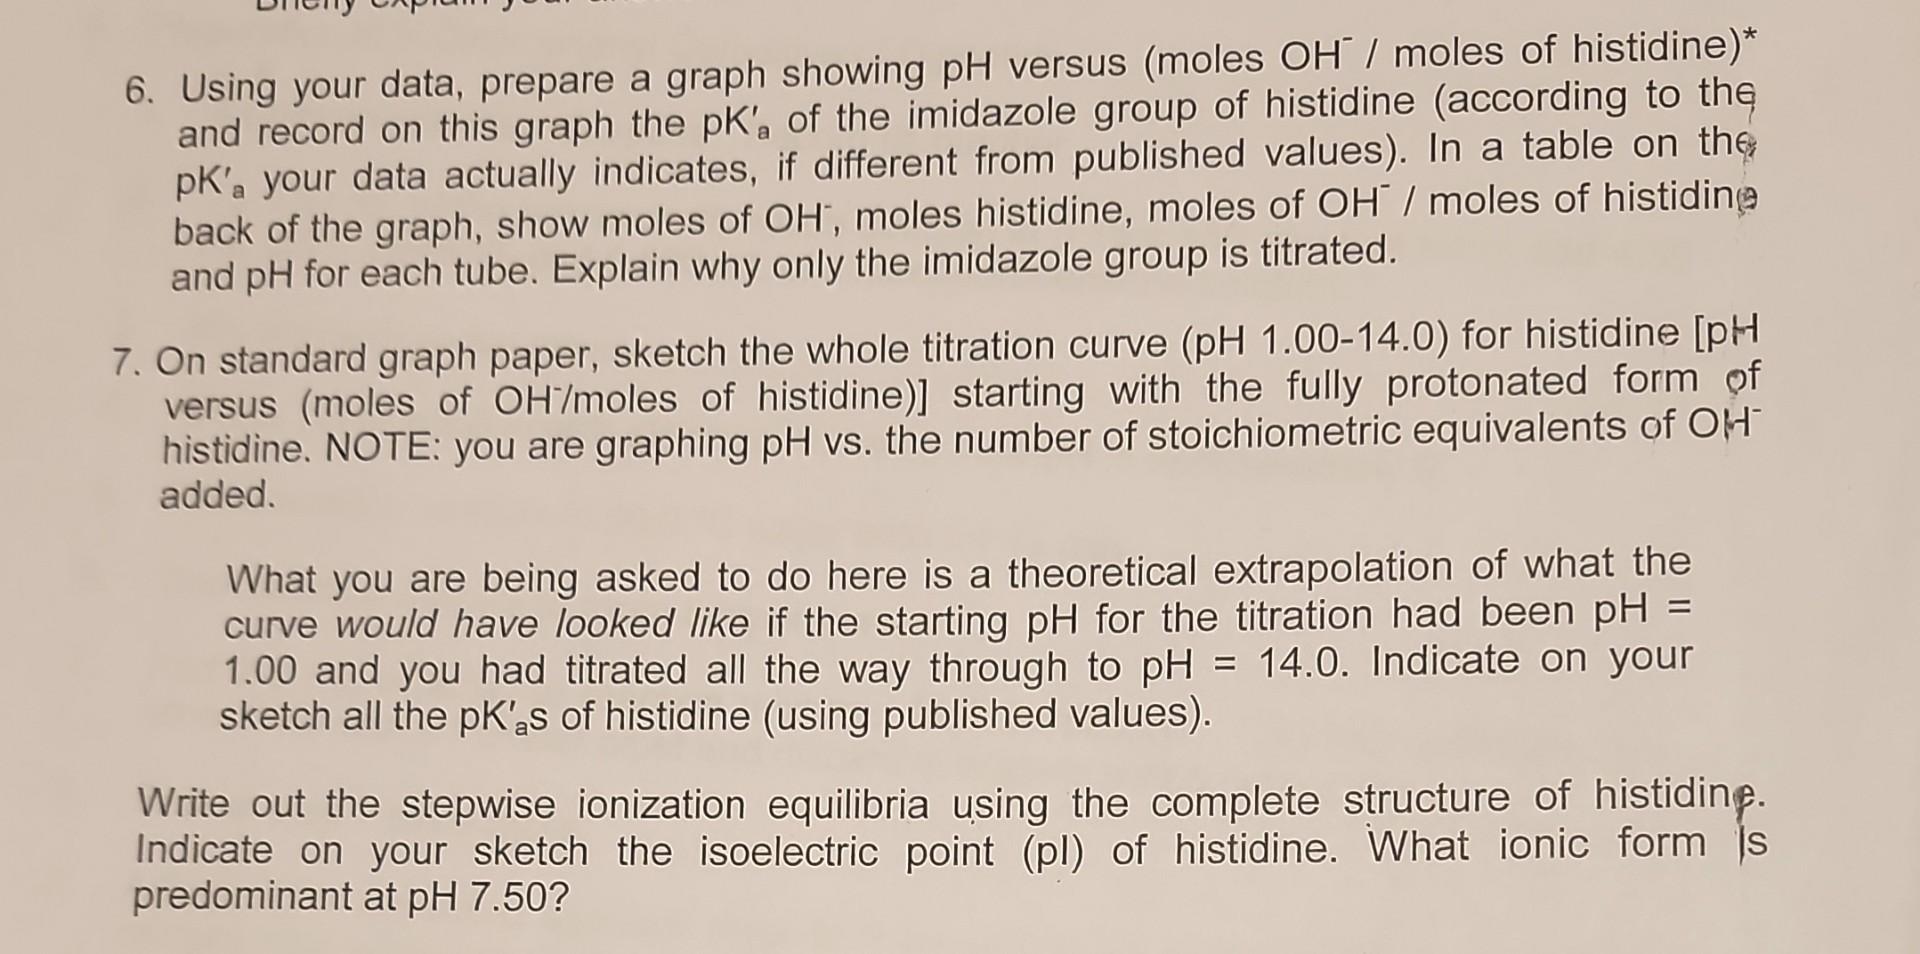
How do you find pka' why is the imidazole group the only geting titratated 7) how to determine the moles of OH/HCl *is the column OH and HCl are the total M in the mixture OH original M is .1059 how to find all the pka's write out stepwise ionization equilibrium what ionic form is predominate at pH7.5 \begin{tabular}{|c|} \hline \multicolumn{2}{|c|}{ Histidine T } \\ \hline Tube \\ \hline 1 \\ \hline 2 \\ \hline 3 \\ \hline 3 \\ \hline 5 \\ \hline 6 \\ \hline 7 \\ \hline 8 \\ \hline 9 \\ \hline 10 \\ \hline \end{tabular} \begin{tabular}{|c|c|c|c|} \hline OH & HCI*His & OH/HCl*His & pH \\ \hline 0 & 0.0167 & 0 & 5.16 \\ \hline 0.001765 & 0.0167 & 0.10568862 & 5.64 \\ \hline 0.00353 & 0.0167 & 0.21137725 & 5.85 \\ \hline 0.005295 & 0.0167 & 0.31706587 & 6.03 \\ \hline 0.00706 & 0.0167 & 0.42275449 & 6.22 \\ \hline 0.008825 & 0.0167 & 0.52844311 & 6.44 \\ \hline 0.01059 & 0.0167 & 0.63413174 & 6.69 \\ \hline 0.012355 & 0.0167 & 0.73982036 & 7.22 \\ \hline 0.01412 & 0.0167 & 0.84550898 & 8.6 \\ \hline 0.01765 & 0.0167 & 1.05688623 & 8.83 \\ \hline & & & \\ \hline \end{tabular} pHvsOH(moles)/His(moles) 6. Using your data, prepare a graph showing pH versus (moles OH/moles of histidine)* and record on this graph the pKa of the imidazole group of histidine (according to the pKa your data actually indicates, if different from published values). In a table on the back of the graph, show moles of OH, moles histidine, moles of OH/moles of histidin and pH for each tube. Explain why only the imidazole group is titrated. 7. On standard graph paper, sketch the whole titration curve (pH 1.00-14.0) for histidine [pH versus (moles of OH/moles of histidine)] starting with the fully protonated form of histidine. NOTE: you are graphing pH vs. the number of stoichiometric equivalents of OH added. What you are being asked to do here is a theoretical extrapolation of what the curve would have looked like if the starting pH for the titration had been pH= 1.00 and you had titrated all the way through to pH=14.0. Indicate on your sketch all the pKas of histidine (using published values). Write out the stepwise ionization equilibria using the complete structure of histidinf. Indicate on your sketch the isoelectric point (pl) of histidine. What ionic form is predominant at pH 7.50Step by Step Solution
There are 3 Steps involved in it
Step: 1

Get Instant Access to Expert-Tailored Solutions
See step-by-step solutions with expert insights and AI powered tools for academic success
Step: 2

Step: 3
Ace Your Homework with AI
Get the answers you need in no time with our AI-driven, step-by-step assistance
Get Started
Physical Chemistry
Authors: Thomas Engel, Philip Reid
3rd edition
805338423, 080533842X, 978-0321812001