I need help with 6-9 please

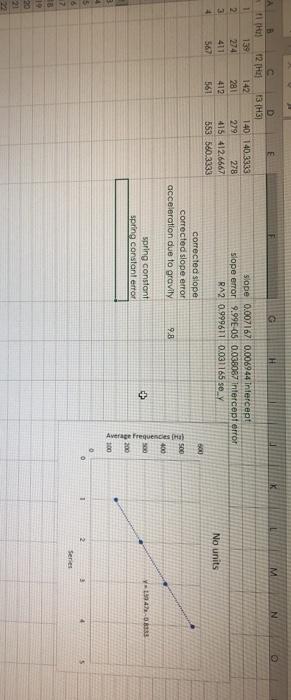
this is my data so far
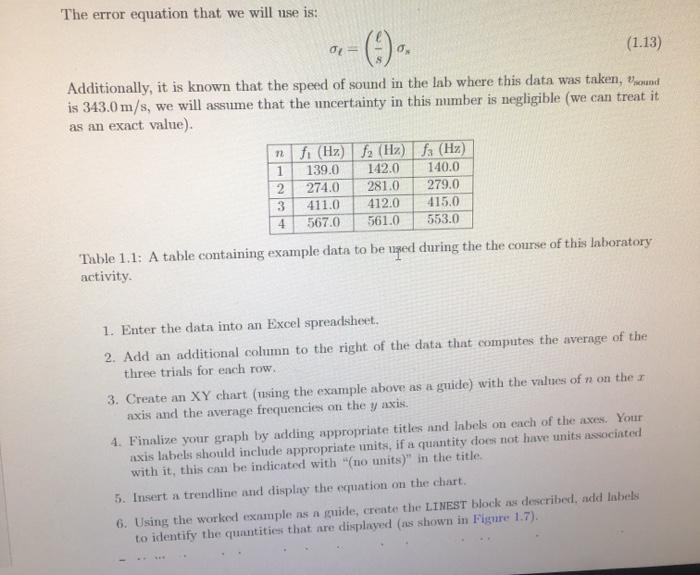
The error equation that we will use is: (1.13) OL- Additionally, it is known that the speed of sound in the lab where this data was taken, Vround is 343.0 m/s, we will assume that the uncertainty in this number is negligible (we can treat it as an exact value) n fi (Hz) 2 (Hz) fa (Hz) 1 139.0 142.0 140.0 2 274.0 281.0 279.0 3 411.0 412.0 415.0 4 567.0 561.0 553.0 Table 1.1: A table containing example data to be used during the the course of this laboratory activity 1. Enter the data into an Excel spreadsheet. 2. Add an additional column to the right of the data that computes the average of the three trials for each row. 3. Create an XY chart (using the example above as a guide) with the values of n on the axis and the average frequencies on the y axis. 4. Finalize your graph by adding appropriate titles and Inbels on each of the axes. Your axis labels should include appropriate units, if a quantity does not have units associated with it, this can be indicated with "(no units)" in the title 5. Insert a trendline and display the equation on the chart. 6. Using the worked example nsn guide, create the LINEST block as described, add labels to identify the quantities that are displayed (as shown in Figure 1.7). 6. Using the worked example as a guide, create the LINEST block as described, add labels to identify the quantities that are displayed (as shown in Figure 1.7). 7. Unlike the worked example, the units are already correct in this example, so no correction needs to be done to the extracted slope. 8. Using Equation 1.12 and and as 343.0 m/s, determine the length of the air column. 9. Using Equation 1.13, determine the uncertainty in the obtained value of l due to the uncertainty in the slope obtained from the LINEST function. F G H M N 12. 1 2 THE 139 274 411 567 13 31 142 140 140.3333 281 279 278 412 415 412.6667 561 553 56013333 slope 0.007167 0.006944 intercept slope error 9.99E-05 0.038087 Intercept error RA2 0.999611 0.031165 sexy No units 500 corrected slope corrected slope error acceleration due to gravily 500 9.8 400 spring constant spring constant effor + y0833 Average Frequencies 200 3 100 5 Series 7 19 The error equation that we will use is: (1.13) OL- Additionally, it is known that the speed of sound in the lab where this data was taken, Vround is 343.0 m/s, we will assume that the uncertainty in this number is negligible (we can treat it as an exact value) n fi (Hz) 2 (Hz) fa (Hz) 1 139.0 142.0 140.0 2 274.0 281.0 279.0 3 411.0 412.0 415.0 4 567.0 561.0 553.0 Table 1.1: A table containing example data to be used during the the course of this laboratory activity 1. Enter the data into an Excel spreadsheet. 2. Add an additional column to the right of the data that computes the average of the three trials for each row. 3. Create an XY chart (using the example above as a guide) with the values of n on the axis and the average frequencies on the y axis. 4. Finalize your graph by adding appropriate titles and Inbels on each of the axes. Your axis labels should include appropriate units, if a quantity does not have units associated with it, this can be indicated with "(no units)" in the title 5. Insert a trendline and display the equation on the chart. 6. Using the worked example nsn guide, create the LINEST block as described, add labels to identify the quantities that are displayed (as shown in Figure 1.7). 6. Using the worked example as a guide, create the LINEST block as described, add labels to identify the quantities that are displayed (as shown in Figure 1.7). 7. Unlike the worked example, the units are already correct in this example, so no correction needs to be done to the extracted slope. 8. Using Equation 1.12 and and as 343.0 m/s, determine the length of the air column. 9. Using Equation 1.13, determine the uncertainty in the obtained value of l due to the uncertainty in the slope obtained from the LINEST function. F G H M N 12. 1 2 THE 139 274 411 567 13 31 142 140 140.3333 281 279 278 412 415 412.6667 561 553 56013333 slope 0.007167 0.006944 intercept slope error 9.99E-05 0.038087 Intercept error RA2 0.999611 0.031165 sexy No units 500 corrected slope corrected slope error acceleration due to gravily 500 9.8 400 spring constant spring constant effor + y0833 Average Frequencies 200 3 100 5 Series 7 19
 I need help with 6-9 please
 this is my data so far


