I need help with all of them please.

The assigned solution is "Drink Mix" please answer all, thank you.
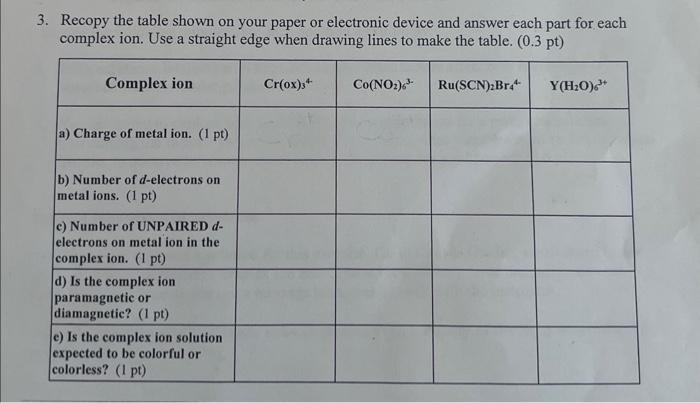
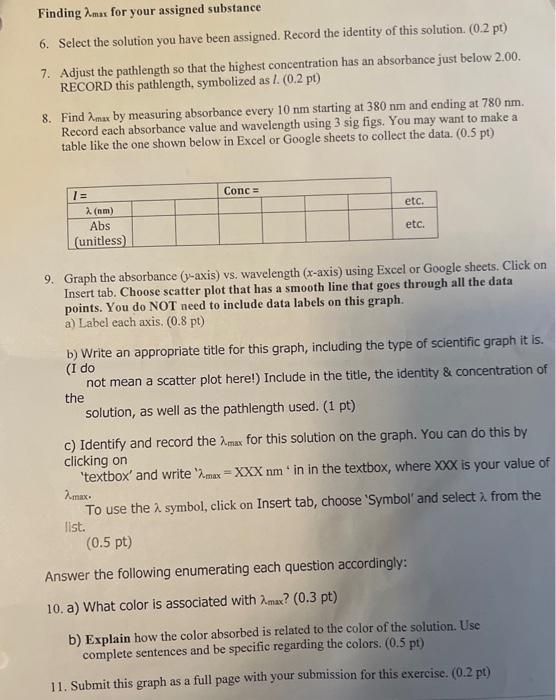
Recopy the table shown on your paper or electronic device and answer each part for each complex ion. Use a straight edge when drawing lines to make the table. (0.3pt) Finding max for your assigned substance 6. Select the solution you have been assigned. Record the identity of this solution. (0.2pt) 7. Adjust the pathlength so that the highest concentration has an absorbance just below 2.00. RECORD this pathlength, symbolized as l.(0.2pt) 8. Find max by measuring absorbance every 10nm starting at 380nm and ending at 780nm. Record each absorbance value and wavelength using 3 sig figs. You may want to make a table like the one shown below in Excel or Google sheets to collect the data. (0.5pt) 9. Graph the absorbance ( y-axis) vs. wavelength ( x-axis) using Excel or Google sheets. Click on Insert tab. Choose scatter plot that has a smooth line that goes through all the data points. You do NOT need to include data labels on this graph. a) Label each axis. (0.8pt) b) Write an appropriate title for this graph, including the type of scientific graph it is. (I do not mean a scatter plot here!) Include in the title, the identity \& concentration of the solution, as well as the pathlength used. (1 pt) c) Identify and record the max for this solution on the graph. You can do this by clicking on 'textbox' and write ' max=XXXnm in in the textbo X,whereXXX is your value of max. To use the symbol, click on Insert tab, choose 'Symbol' and select from the ilst. (0.5pt) Answer the following enumerating each question accordingly: 10. a) What color is associated with max?(0.3pt) b) Explain how the color absorbed is related to the color of the solution. Use complete sentences and be specific regarding the colors. (0.5pt) Recopy the table shown on your paper or electronic device and answer each part for each complex ion. Use a straight edge when drawing lines to make the table. (0.3pt) Finding max for your assigned substance 6. Select the solution you have been assigned. Record the identity of this solution. (0.2pt) 7. Adjust the pathlength so that the highest concentration has an absorbance just below 2.00. RECORD this pathlength, symbolized as l.(0.2pt) 8. Find max by measuring absorbance every 10nm starting at 380nm and ending at 780nm. Record each absorbance value and wavelength using 3 sig figs. You may want to make a table like the one shown below in Excel or Google sheets to collect the data. (0.5pt) 9. Graph the absorbance ( y-axis) vs. wavelength ( x-axis) using Excel or Google sheets. Click on Insert tab. Choose scatter plot that has a smooth line that goes through all the data points. You do NOT need to include data labels on this graph. a) Label each axis. (0.8pt) b) Write an appropriate title for this graph, including the type of scientific graph it is. (I do not mean a scatter plot here!) Include in the title, the identity \& concentration of the solution, as well as the pathlength used. (1 pt) c) Identify and record the max for this solution on the graph. You can do this by clicking on 'textbox' and write ' max=XXXnm in in the textbo X,whereXXX is your value of max. To use the symbol, click on Insert tab, choose 'Symbol' and select from the ilst. (0.5pt) Answer the following enumerating each question accordingly: 10. a) What color is associated with max?(0.3pt) b) Explain how the color absorbed is related to the color of the solution. Use complete sentences and be specific regarding the colors. (0.5pt)


