

Question
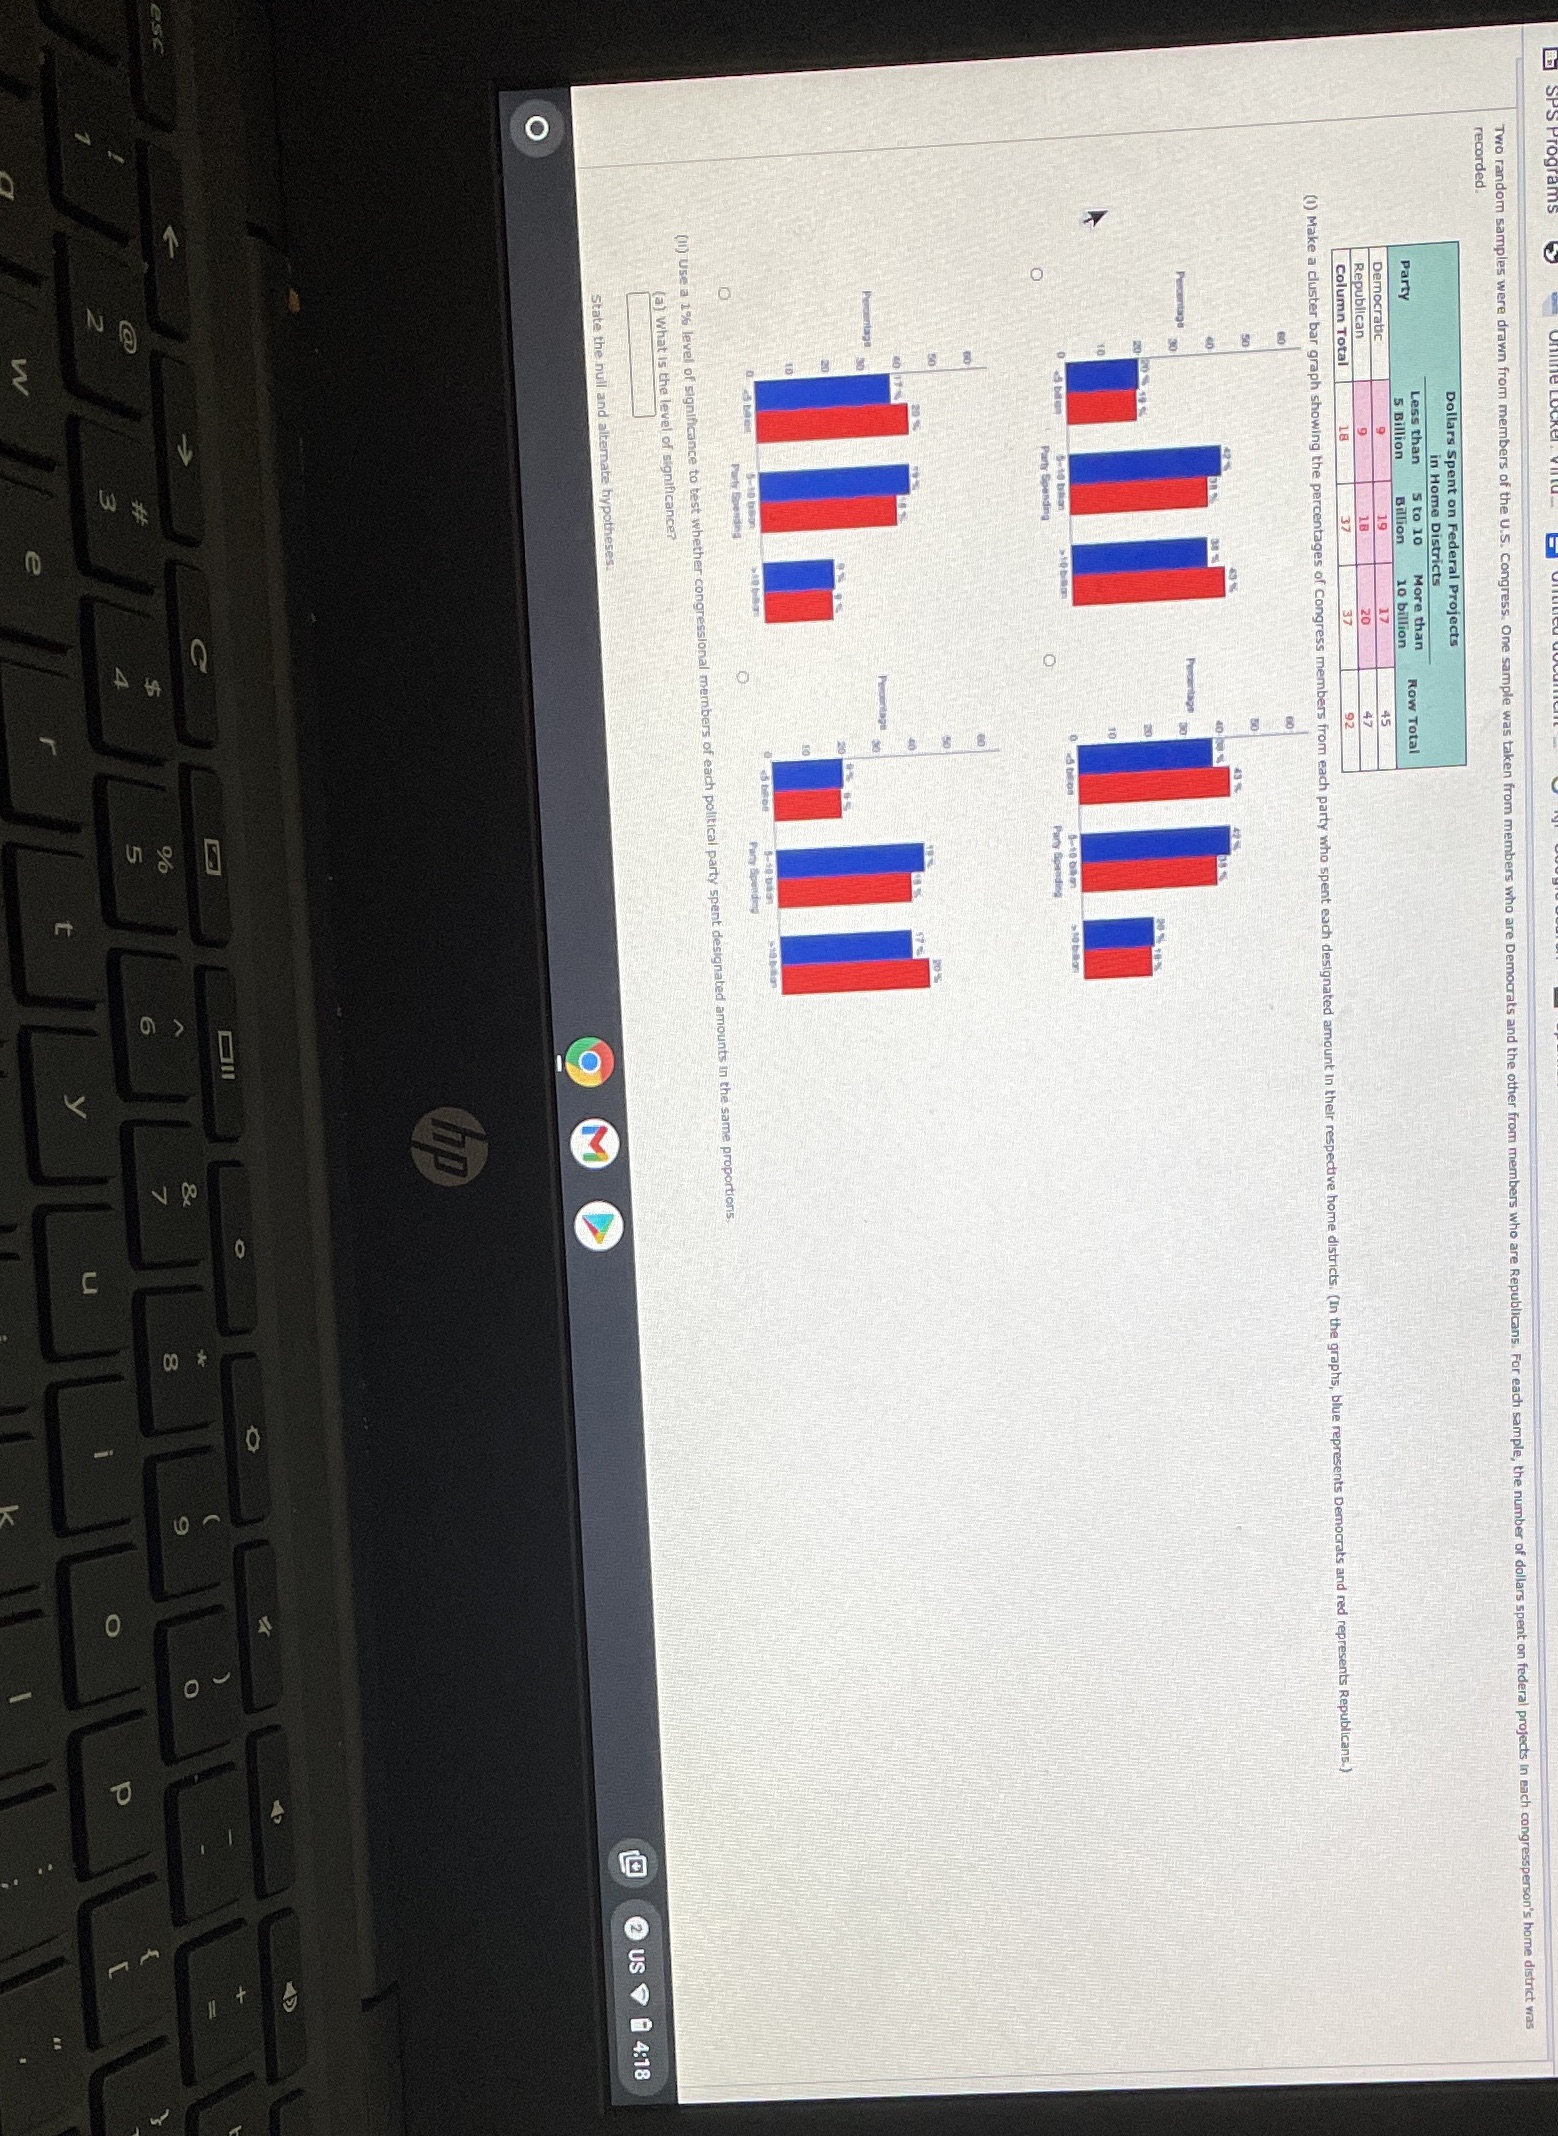
I need help with all the questions shown in the image and State the null and alternate hypothesis. -H0: same proportion of Democrats and Republicans
I need help with all the questions shown in the image and State the null and alternate hypothesis. -H0: same proportion of Democrats and Republicans within each spending level H1: different proportions of Democrats and Republicans within each spending level-H0: same proportion of Democrats and Republicans within each spending level H1: same proportion of Democrats and Republicans within each spending level-H0: different proportion of Democrats and Republicans within each spending level. H1: different proportion of Democrats and Republicans within each spending level- H0: different proportion of Democrats and Republicans within each spending level H1: same proportion of Democrats and Republicans within each spending level(b) find the value of Chi-square statistic for the sample. (round the expected frequencies to at least three decimal places. Round the test statistic to three decimal places.)- Are all the expected frequencies greater than 5?- what sampling distribution will you use?-students t -binomial -uniform-chi-square -normal what are the degrees of freedom?___(c) find or estimate the P-value of the sample test statistic. (round your answer to three decimal places)(d) Based on your answers in parts (a) to (c) will reject or fail to reject the null hypothesis of independence?-Sine P-value > x we fail to reject the null hypothesis -Since P-value > x we reject the null hypothesis -Since P-value ? x we reject the null hypothesis -Since P-value ? x we fail to reject the null hypothesis
Step by Step Solution
There are 3 Steps involved in it
Step: 1

Get Instant Access to Expert-Tailored Solutions
See step-by-step solutions with expert insights and AI powered tools for academic success
Step: 2

Step: 3
Ace Your Homework with AI
Get the answers you need in no time with our AI-driven, step-by-step assistance
Get Started
Finite Math And Applied Calculus
Authors: Stefan Waner, Steven Costenoble
2nd Edition
0534366309, 9780534366308