i need help with an accounts receivable analysis which includes accounts receivable turnover number of days sales in receivables the inventory analysis with the inventory turnover and the number of days sales in inventory

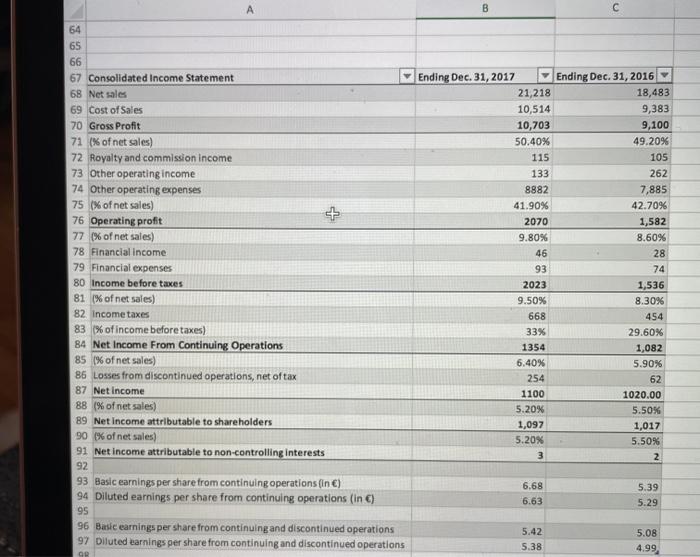
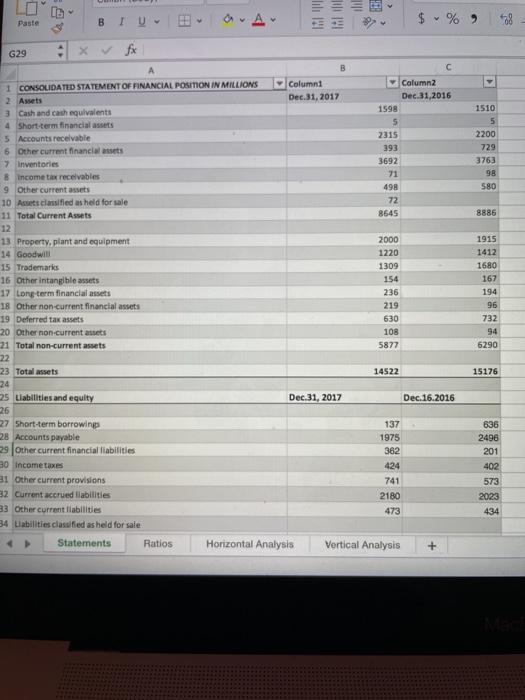
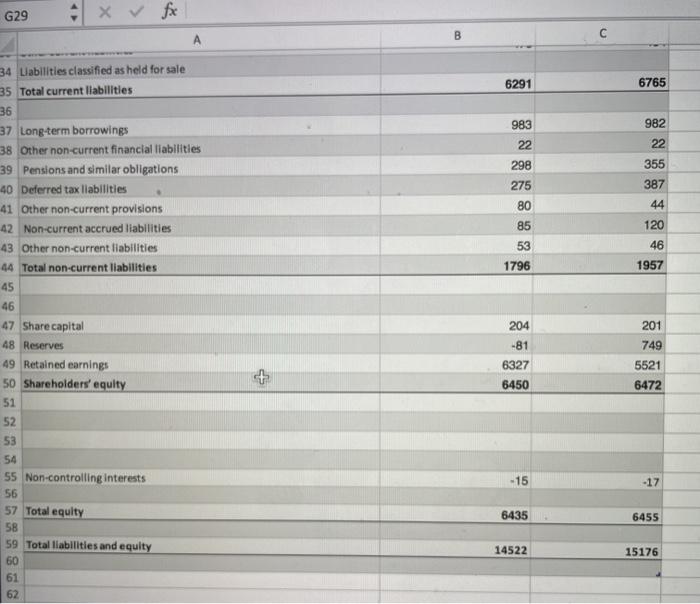
B + 64 65 66 67 Consolidated Income Statement 68 Net sales 69 Cost of Sales 70 Gross Profit 71 (% of net sales) 72 Royalty and commission income 73 Other operating income 74 Other operating expenses 75 % of net sales) 76 Operating profit 77 (% of net sales) 78 Financial income 79 Financial expenses 80 Income before taxes 81 % of net sales) 82 Income taxes 83 % of income before taxes) 84 Net Income From Continuing Operations 85 % of net sales) 86 Losses from discontinued operations, net of tax 87 Net Income 88 % of net sales) 89 Net Income attributable to shareholders 90 % of net sales) 91 Net income attributable to non-controlling interests 92 93 Basic earnings per share from continuing operations (in ) 94 Diluted earnings per share from continuing operations (in C) 95 96 Basic earnings per share from continuing and discontinued operations 97 Diluted earnings per share from continuing and discontinued operations Ending Dec. 31, 2017 21,218 10,514 10,703 50.40% 115 133 8882 41.90% 2070 9.80% 46 93 2023 9.50% 668 33% 1354 6.40% 254 1100 5.20% 1,097 5.20% 3 Ending Dec. 31, 2016 18,483 9,383 9,100 49.20% 105 262 7,885 42.70% 1,582 8.60% 28 74 1,536 8.30% 454 29.60% 1,082 5.90% 62 1020.00 5.50% 1,017 5.50% 2 6.68 6.63 5.39 5.29 5.42 5.38 5.08 4.99 GO Paste BIU 1598 1510 393 3692 2200 729 3763 98 580 8886 1915 G29 x B 1 CONSOLIDATED STATEMENT OF FINANCIAL POSITION IN MILLIONS Columni Column2 2 Assets Dec 31, 2017 Dec 31,2016 3 Cash and cash equivalents 4 Short-term financial assets 5 5 Accounts receivable 2315 6 Other current financiales 7 Inventories 8 Income tax receivables 71 9 Other current assets 498 10 Aesclassified as held for sale 72 11 Total Current Assets 8645 12 13 Property, plant and equipment 2000 14 Goodwill 1220 15 Trademarks 1309 16 Other intangible assets 154 17 Long-term financial assets 236 18 Other non-current financial assets 219 19 Deferred tax assets 630 20 Other non-current assets 108 21 Total non-current assets 5877 22 23 Total assets 14522 24 Liabilities and equity Dec 31, 2017 Dec.16.2016 26 27 Short-term borrowing 137 28 Accounts payable 975 29 Other current financial liabilities 362 30 Income taxes 424 31 Other current provisions 741 32 Current accrued abilities 2180 33 Other current liabilities 473 34 Liabilities classified as held for sale Statements Ratios Horizontal Analysis Vertical Analysis + 1412 1680 167 194 96 732 94 6290 15176 636 2496 201 402 573 2023 434 G29 x fx B 6291 6765 983 982 22 22 298 355 275 387 44 80 85 120 46 53 1796 1957 34 Liabilities classified as held for sale 35 Total current liabilities 36 37 Long-term borrowings 38 Other non-current financial liabilities 39 Pensions and similar obligations 40 Deferred tax liabilities 41 Other non-current provisions 42 Non-current accrued liabilities 43 Other non-current liabilities 44 Total non-current liabilities 45 46 47 Share capital 48 Reserves 49 Retained earnings 50 Shareholders' equity 51 52 53 54 55 Non-controlling interests 56 57 Total equity 58 59 Total liabilities and equity 60 61 62 201 749 204 -81 6327 6450 5521 + 6472 -15 -17 6435 6455 14522 15176


