Question
I need help with completing the bar function and the add_tick_y function, and need help fixing any other errors. Below is the code I have


I need help with completing the bar function and the add_tick_y function, and need help fixing any other errors. Below is the code I have so far. Please write code in Python!
# This program will draw a bar chart representing pie preferences using turtle
import turtle turtle.speed("fastest")
# Draws the axes of a coordinate system. def setup_coordinate_system(min_x, min_y, max_x, max_y): padding = 5 # This turtle function changes where (0,0) is on the screen. turtle.setworldcoordinates(min_x-padding, min_y-padding, max_x+padding, max_y+padding) cross(min_x, min_y, max_x, max_y)
# Draws the cross of the bar chart def cross(min_x, min_y, max_x, max_y): # draws a horizontal line turtle.penup() turtle.goto(min_x,0) turtle.pendown() turtle.goto(max_x,0)
# draws a vertical line turtle.penup() turtle.goto(0,min_y) turtle.pendown() turtle.goto(0,max_y)
# Draws the bars of the bar chart def rectangle(x, y, width, height): # sets the position turtle.up() turtle.setpos(x,y) turtle.down()
# draws a rectangle turtle.forward(width) turtle.left(90)
turtle.forward(height) turtle.left(90)
turtle.forward(width) turtle.left(90)
# returns to starting position turtle.forward(height) turtle.left(90)
# Draw a bar of the given height at the given x location and fill it with the given color. # Add the given label underneath. def bar(height, x, color, label): turtle.fillcolor(color) turtle.begin_fill() turtle.left(90) turtle.forward(height) turtle.write(height) turtle.right(90) turtle.forward(40) turtle.right(90) turtle.forward(height) turtle.left(90) turtle.end_fill() print(label)
# Draw a tick mark and label at the indicated position on the y-axis. def add_tick_y(y_val): pass
# drawing the bar chart setup_coordinate_system(-10, -10, 180, 120) add_tick_y(100) add_tick_y(50) bar(85, 10, "red", "Strawberry Rhubarb") bar(64, 40, "orange", "Pumpkin") bar(75, 70, "yellow", "Lemon Meringue") bar(100, 100, "blue", "Blueberry") bar(51, 130, "green", "Key Lime")
turtle.hideturtle()
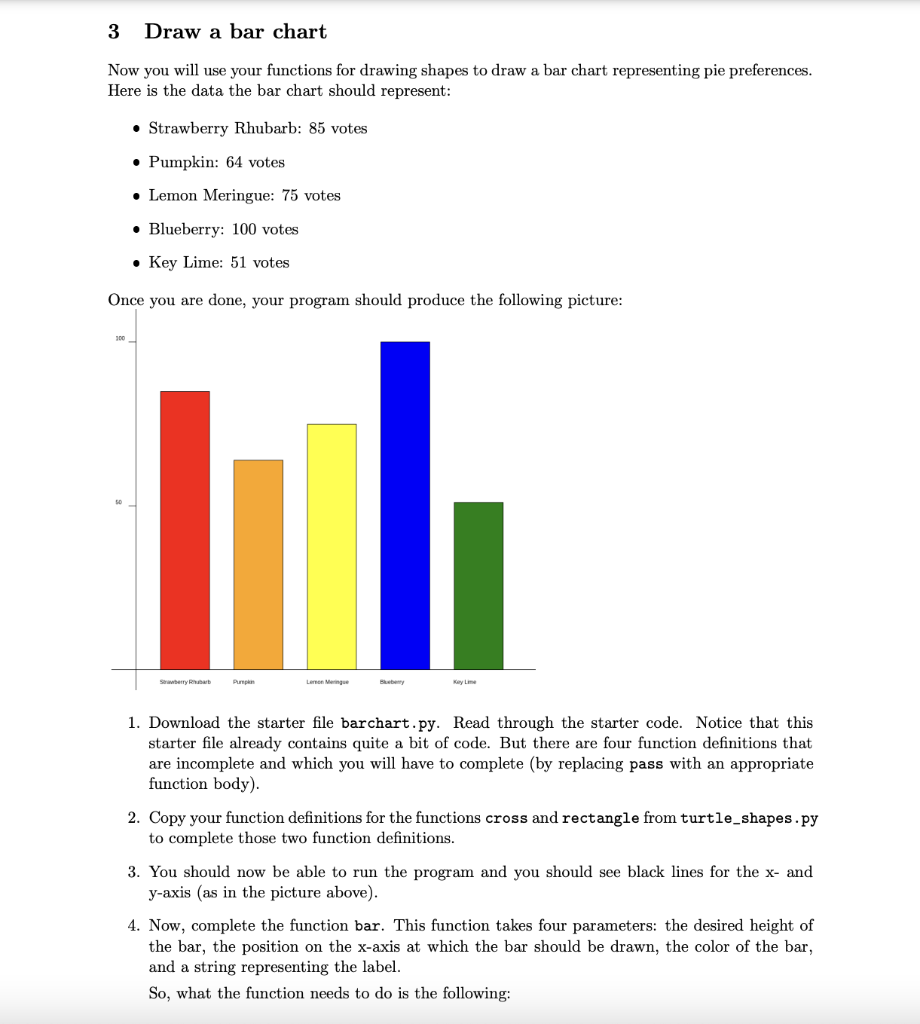
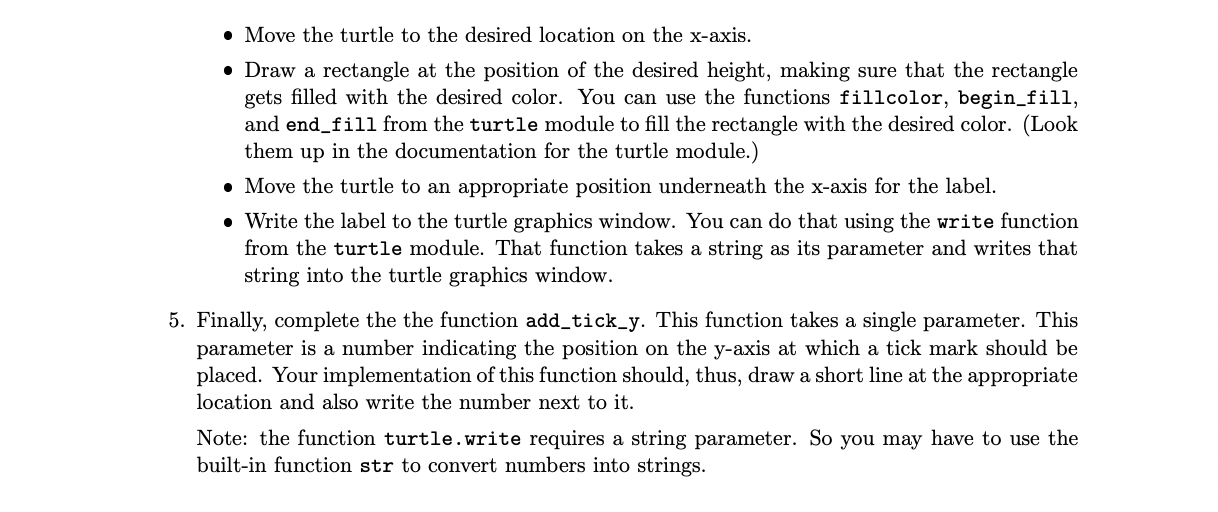
3 Draw a bar chart Now you will use your functions for drawing shapes to draw a bar chart representing pie preferences. Here is the data the bar chart should represent: Strawberry Rhubarb: 85 votes Pumpkin: 64 votes Lemon Meringue: 75 votes Blueberry: 100 votes . Key Lime: 51 votes Once you are done, your program should produce the following picture: 300 Strawberry Pump Lernen Mengue Key Lime 1. Download the starter file barchart.py. Read through the starter code. Notice that this starter file already contains quite a bit of code. But there are four function definitions that are incomplete and which you will have to complete (by replacing pass with an appropriate function body) 2. Copy your function definitions for the functions cross and rectangle from turtle_shapes.py to complete those two function definitions. 3. You should now be able to run the program and you should see black lines for the x- and y-axis (as in the picture above). 4. Now, complete the function bar. This function takes four parameters: the desired height of the bar, the position on the x-axis at which the bar should be drawn, the color of the bar, and a string representing the label. So, what the function needs to do is the following: Move the turtle to the desired location on the x-axis. Draw a rectangle at the position of the desired height, making sure that the rectangle gets filled with the desired color. You can use the functions fillcolor, begin_fill, and end_fill from the turtle module to fill the rectangle with the desired color. (Look them up in the documentation for the turtle module.) Move the turtle to an appropriate position underneath the x-axis for the label. Write the label to the turtle graphics window. You can do that using the write function from the turtle module. That function takes a string as its parameter and writes that string into the turtle graphics window. 5. Finally, complete the the function add_tick_y. This function takes a single parameter. This parameter is a number indicating the position on the y-axis at which a tick mark should be placed. Your implementation of this function should, thus, draw a short line at the appropriate location and also write the number next to it. Note: the function turtle.write requires a string parameter. So you may have to use the built-in function str to convert numbers into stringsStep by Step Solution
There are 3 Steps involved in it
Step: 1

Get Instant Access to Expert-Tailored Solutions
See step-by-step solutions with expert insights and AI powered tools for academic success
Step: 2

Step: 3

Ace Your Homework with AI
Get the answers you need in no time with our AI-driven, step-by-step assistance
Get Started


