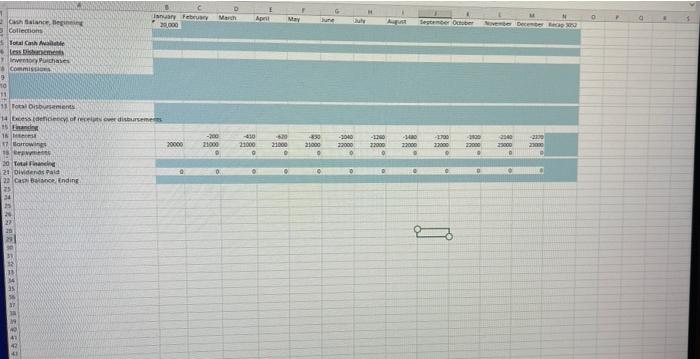
I need help with formulas for the last page " cash budget.
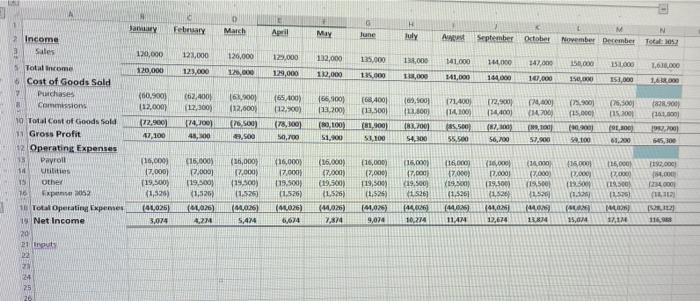
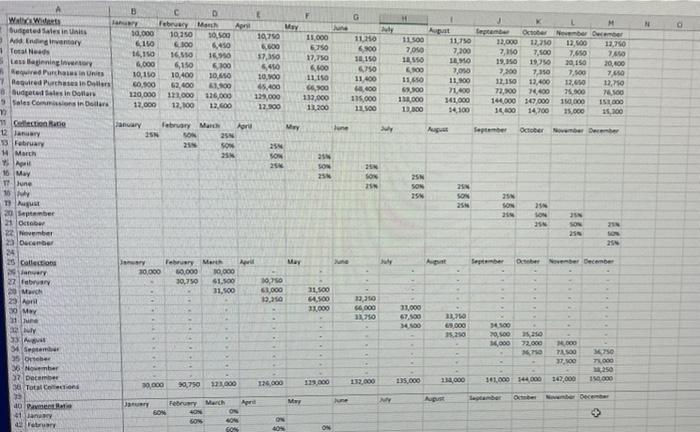
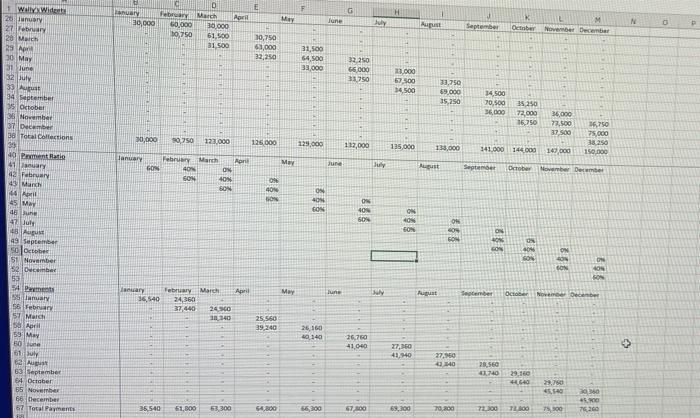
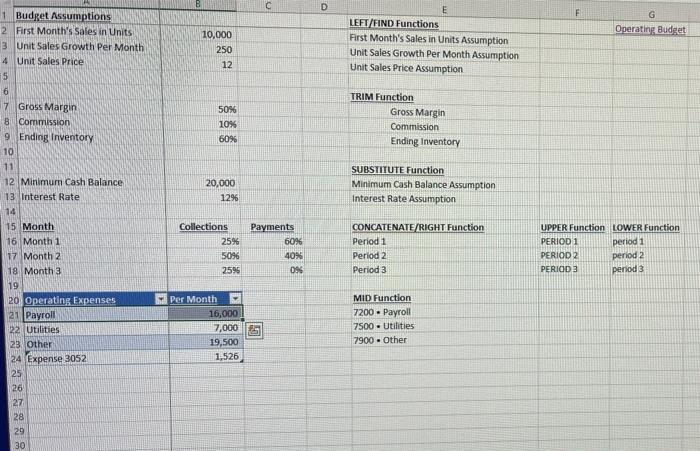
Jay H February Mans April My June ul AR September October M November December 2 Income Sales Total 102 120,000 120,000 120,000 125,000 132,000 135.000 133.000 141000 141.000 142.000 15.000 131.000 120.000 1.610.000 125.000 1.000 129,000 110,000 135.000 1.000 141,00) 164,000 10.000 150.00 153,000 16.300) 112,600) local 260.500) 112,000) 12.900) 47,100 (05,500 1.100 loos (62.4001 (12,300) 74.2001 45,00 ) (6500) (120 (78.300) 50,700 (68.4001 113.300) 181.100) 156,100) 113.2001 (80.100) 51,200 1828.900 101.000 [76,500) 3,500 171.400) 114,100 185.500 55.900 14,600 (14700 (10 57.900 114.400) 18.00) 56,700 (7.900 115.000 (200) 59.100 (23.500 115.2001 191.300) 61,200 (83.700) 54.300 OOTS 545,300 Total income Cost of Goods Sold Purchases Commissions 19 Total cost of Goods Sold 1. Gross Profit 12 Operating Expenses Payroll Utilities TS Othed 16 fixpense 2052 1 Total Operating Expenses 19 Net Income 20 21 traits 22 115,000) 17.0001 (19,500) (1,3263 (41,025) 3,074 (15,000) 17,0001 119.500) (1.526) (1026) 4.27 ) (36,000) 17.000) (15.300) (1,5290 1.0.6) 5,474 ) 116.0001 17.000 119.500) 1.526) ML026) (16.000) 47.000 (19.500 (1.526) (44,025) 7,874 115,000 (7.000 (19,500 (1526 (16,000) 17,000 119,50 (1.526) (41,025) 9,074 (16,00 17.000) 19.00 1.526 16,000 17.000 119.500 (1.52 (14000) 7.000 119.500 1526 144.0 13.874 415.000 0.000 (19.500 (1.50 HOME 15,0/14 ! 1192.000 15.000 1234.000 (112) 115.000 12.000 TES. 11.576) MA 1,1 ) 144.6261 10,274 (44026 1142 (41,035 12,674 674 ta 24 25 26 F H W N O An G wy 1120 DOS OS 11.000 0919 OSES DOSTI Os' 006 B D Wat Wide LY February March April Bupated sales in its 10,000 10250 10710 Addrary 6.100 450 6,600 Tots News 16110 16110 16.950 5 Loss Beginning 57,350 6,000 6.100 540 wachawi URE 10,150 10.400 10.450 10.600 7 Regre Purchases in 60,500 62.400 45.400 Budges in Dollar 130,000 123,000 126,000 133.000 5 Sales Commissions in Dollars 12.000 12,100 12. GOO 12.300 17,750 OSI'S OT OSCAT Aut fepten October November December 11.10 12.000 12.10 12.00 12,750 7,200 3,150 7.500 7.650 7,650 100 19,150 20150 20,000 7,050 7,200 7,150 7.500 7.60 15.650 11.00 12,150 12.400 12.650 12,750 62.100 71,400 72,300 00 75.000 7.500 11.000 141.000 144.000 10.000 150,000 151000 13.300 14100 14100 14 700 15.000 2,100 00 OOSE 10 150 10 11400 400 115.000 11.00 11150 66.00 133.000 11.200 May June 3 Aug October November December Colection ang anuary 3 February 14 March January February March April 35 SON NIE 25N SON 25 SON 16 May 24 SO NS2 Tune NE SON NE 15 SON wa WIE NOS WIE Non NIE Na NIE 20 September 21 October 22 hovember 23 December 24 25 catec NIE May 3 October November December eurs nary February Mar Al 10,000 50,000 30,000 30,750 61. O 31.500 os.co OOSTE 68,000 12,50 OD 11 000 ost'te 000 OSTE 31.000 67,500 340 OTT 000 AN 6 15.20 14500 20.00 14.000 o' 10 27 February 20 March 23 30 May 1 32 NY 55 g 34 Septe 35 ore 36 Nober 07 December Total Can 3 40 Pameti 41 Terus 72.000 MO OD 7ALOO 37. SOO 750 71.000 1250 110.000 133.000 123,000 126.000 90,750 135.000 114.000 132.000 149.000 19.000 101.000 144000 Apr My MY August UNT February March GON SOM NOT > WO 85 ON G H June July 1 August N D E nuary February March April My 30,000 60,000 30.000 0.750 61,500 10,750 31 500 61,000 32,250 K Deter o September M November Decenter 31,500 64,500 33,000 32.250 66000 35750 1000 57.100 14.500 - 33.750 59.000 15.250 14,500 10,500 36,000 35.250 72,000 16,750 36,000 77,500 37 500 230,000 99,350 123.000 125.000 129,000 16.750 75.000 3820 150.000 112,000 135,000 133,000 141 000 144 000 147,000 January February March Muy June GON July August September October November December AN SON April ON 40 SON 40 1 Willy Wide 20 Ianuary 27 February 20 March 29A 30 May 31 June 32 July 33 August 34 September 3 October 30 November 37 December 38 Total Collections 35 40 Pimentatie 41 ay 42 Fabruary 4 MAN 44 April 45 10 97 July August 19 September So October 51 November 52 loc 53 54 Det Sama 56 Feb 51 March 581 159 May 5011 61. Sul 6 Aug 63 September 54 October 55 November 66 December 67 Total Payments ON 40N FON ON 40N 60 ON 40 50 657 989 863 May June 3 August September Oto December 36,540 February March April 24,360 37,440 24 50 30-340 25,560 39,240 26. 160 40 140 26,760 41.040 4 27,160 41.940 27.10 140 28.560 4740 29,160 HO 9. 2020 4. 7626 35 540 51,000 53,300 54.300 56,100 100 69,300 70-200 72.300 TO 7500 c D D F G Operating Budget 1 Budget Assumptions 2 First Month's Sales in Units 3 Unit Sales Growth Per Month 4 Unit Sales Price 5 10,000 250 12 E LEFT/FIND Functions First Month's Sales in Units Assumption Unit Sales Growth Per Month Assumption Unit Sales Price Assumption 6 50% 10% 60% TRIM Function Gross Margin Commission Ending Inventory 20,000 1296 SUBSTITUTE Function Minimum Cash Balance Assumption Interest Rate Assumption Collections 25% 5096 25% Payments 60% 40% 09 7 Gross Margin 8 Commission 9 Ending Inventory 10 11 12 Minimum Cash Balance 13 interest Rate 14 15 Month 16. Month 1 17 Month 2 18 Month 3 19 20 Operating Expenses 21 Payroll 22 Utilities 23. Other 24 Expense 3052 25 26 27 28 29 30 CONCATENATE/RIGHT Function Period 1 Period 2 Period 3 UPPER Function LOWER Function PERIOD 1 period 1 PERIOD 2 period 2 PERIOD 3 period 3 Per Month 16,000 7,000 19,500 1,526 MID Function 7200. Payroll 7500. Utilities 7900. Other My June a tember October December D Innuary February One De March Apr 20.000 Collections Tash e Lessments Purchases Commons 9 10 11 11 Total 14 best of disburseme 1 and 16 -200 -430 17 wines 21000 21000 18 9 LA Tea - 21 Divina Pate 0 o 22 CB Ending -10 000 1000 2000 -3040 23000 23000 2040 2000 23000 100 2000 27000 Jay H February Mans April My June ul AR September October M November December 2 Income Sales Total 102 120,000 120,000 120,000 125,000 132,000 135.000 133.000 141000 141.000 142.000 15.000 131.000 120.000 1.610.000 125.000 1.000 129,000 110,000 135.000 1.000 141,00) 164,000 10.000 150.00 153,000 16.300) 112,600) local 260.500) 112,000) 12.900) 47,100 (05,500 1.100 loos (62.4001 (12,300) 74.2001 45,00 ) (6500) (120 (78.300) 50,700 (68.4001 113.300) 181.100) 156,100) 113.2001 (80.100) 51,200 1828.900 101.000 [76,500) 3,500 171.400) 114,100 185.500 55.900 14,600 (14700 (10 57.900 114.400) 18.00) 56,700 (7.900 115.000 (200) 59.100 (23.500 115.2001 191.300) 61,200 (83.700) 54.300 OOTS 545,300 Total income Cost of Goods Sold Purchases Commissions 19 Total cost of Goods Sold 1. Gross Profit 12 Operating Expenses Payroll Utilities TS Othed 16 fixpense 2052 1 Total Operating Expenses 19 Net Income 20 21 traits 22 115,000) 17.0001 (19,500) (1,3263 (41,025) 3,074 (15,000) 17,0001 119.500) (1.526) (1026) 4.27 ) (36,000) 17.000) (15.300) (1,5290 1.0.6) 5,474 ) 116.0001 17.000 119.500) 1.526) ML026) (16.000) 47.000 (19.500 (1.526) (44,025) 7,874 115,000 (7.000 (19,500 (1526 (16,000) 17,000 119,50 (1.526) (41,025) 9,074 (16,00 17.000) 19.00 1.526 16,000 17.000 119.500 (1.52 (14000) 7.000 119.500 1526 144.0 13.874 415.000 0.000 (19.500 (1.50 HOME 15,0/14 ! 1192.000 15.000 1234.000 (112) 115.000 12.000 TES. 11.576) MA 1,1 ) 144.6261 10,274 (44026 1142 (41,035 12,674 674 ta 24 25 26 F H W N O An G wy 1120 DOS OS 11.000 0919 OSES DOSTI Os' 006 B D Wat Wide LY February March April Bupated sales in its 10,000 10250 10710 Addrary 6.100 450 6,600 Tots News 16110 16110 16.950 5 Loss Beginning 57,350 6,000 6.100 540 wachawi URE 10,150 10.400 10.450 10.600 7 Regre Purchases in 60,500 62.400 45.400 Budges in Dollar 130,000 123,000 126,000 133.000 5 Sales Commissions in Dollars 12.000 12,100 12. GOO 12.300 17,750 OSI'S OT OSCAT Aut fepten October November December 11.10 12.000 12.10 12.00 12,750 7,200 3,150 7.500 7.650 7,650 100 19,150 20150 20,000 7,050 7,200 7,150 7.500 7.60 15.650 11.00 12,150 12.400 12.650 12,750 62.100 71,400 72,300 00 75.000 7.500 11.000 141.000 144.000 10.000 150,000 151000 13.300 14100 14100 14 700 15.000 2,100 00 OOSE 10 150 10 11400 400 115.000 11.00 11150 66.00 133.000 11.200 May June 3 Aug October November December Colection ang anuary 3 February 14 March January February March April 35 SON NIE 25N SON 25 SON 16 May 24 SO NS2 Tune NE SON NE 15 SON wa WIE NOS WIE Non NIE Na NIE 20 September 21 October 22 hovember 23 December 24 25 catec NIE May 3 October November December eurs nary February Mar Al 10,000 50,000 30,000 30,750 61. O 31.500 os.co OOSTE 68,000 12,50 OD 11 000 ost'te 000 OSTE 31.000 67,500 340 OTT 000 AN 6 15.20 14500 20.00 14.000 o' 10 27 February 20 March 23 30 May 1 32 NY 55 g 34 Septe 35 ore 36 Nober 07 December Total Can 3 40 Pameti 41 Terus 72.000 MO OD 7ALOO 37. SOO 750 71.000 1250 110.000 133.000 123,000 126.000 90,750 135.000 114.000 132.000 149.000 19.000 101.000 144000 Apr My MY August UNT February March GON SOM NOT > WO 85 ON G H June July 1 August N D E nuary February March April My 30,000 60,000 30.000 0.750 61,500 10,750 31 500 61,000 32,250 K Deter o September M November Decenter 31,500 64,500 33,000 32.250 66000 35750 1000 57.100 14.500 - 33.750 59.000 15.250 14,500 10,500 36,000 35.250 72,000 16,750 36,000 77,500 37 500 230,000 99,350 123.000 125.000 129,000 16.750 75.000 3820 150.000 112,000 135,000 133,000 141 000 144 000 147,000 January February March Muy June GON July August September October November December AN SON April ON 40 SON 40 1 Willy Wide 20 Ianuary 27 February 20 March 29A 30 May 31 June 32 July 33 August 34 September 3 October 30 November 37 December 38 Total Collections 35 40 Pimentatie 41 ay 42 Fabruary 4 MAN 44 April 45 10 97 July August 19 September So October 51 November 52 loc 53 54 Det Sama 56 Feb 51 March 581 159 May 5011 61. Sul 6 Aug 63 September 54 October 55 November 66 December 67 Total Payments ON 40N FON ON 40N 60 ON 40 50 657 989 863 May June 3 August September Oto December 36,540 February March April 24,360 37,440 24 50 30-340 25,560 39,240 26. 160 40 140 26,760 41.040 4 27,160 41.940 27.10 140 28.560 4740 29,160 HO 9. 2020 4. 7626 35 540 51,000 53,300 54.300 56,100 100 69,300 70-200 72.300 TO 7500 c D D F G Operating Budget 1 Budget Assumptions 2 First Month's Sales in Units 3 Unit Sales Growth Per Month 4 Unit Sales Price 5 10,000 250 12 E LEFT/FIND Functions First Month's Sales in Units Assumption Unit Sales Growth Per Month Assumption Unit Sales Price Assumption 6 50% 10% 60% TRIM Function Gross Margin Commission Ending Inventory 20,000 1296 SUBSTITUTE Function Minimum Cash Balance Assumption Interest Rate Assumption Collections 25% 5096 25% Payments 60% 40% 09 7 Gross Margin 8 Commission 9 Ending Inventory 10 11 12 Minimum Cash Balance 13 interest Rate 14 15 Month 16. Month 1 17 Month 2 18 Month 3 19 20 Operating Expenses 21 Payroll 22 Utilities 23. Other 24 Expense 3052 25 26 27 28 29 30 CONCATENATE/RIGHT Function Period 1 Period 2 Period 3 UPPER Function LOWER Function PERIOD 1 period 1 PERIOD 2 period 2 PERIOD 3 period 3 Per Month 16,000 7,000 19,500 1,526 MID Function 7200. Payroll 7500. Utilities 7900. Other My June a tember October December D Innuary February One De March Apr 20.000 Collections Tash e Lessments Purchases Commons 9 10 11 11 Total 14 best of disburseme 1 and 16 -200 -430 17 wines 21000 21000 18 9 LA Tea - 21 Divina Pate 0 o 22 CB Ending -10 000 1000 2000 -3040 23000 23000 2040 2000 23000 100 2000 27000
