

Question: I need help with how to do a DCF analysis for this Spotify case. Please can you show the explanation of the steps Thank you
I need help with how to do a DCF analysis for this Spotify case. Please can you show the explanation of the steps Thank you
A. Using the information provided, what should SPs shares be trading at on the first day of its listing?
-
Conduct a DCF analysis.
-
Conduct a comparable companies analysis
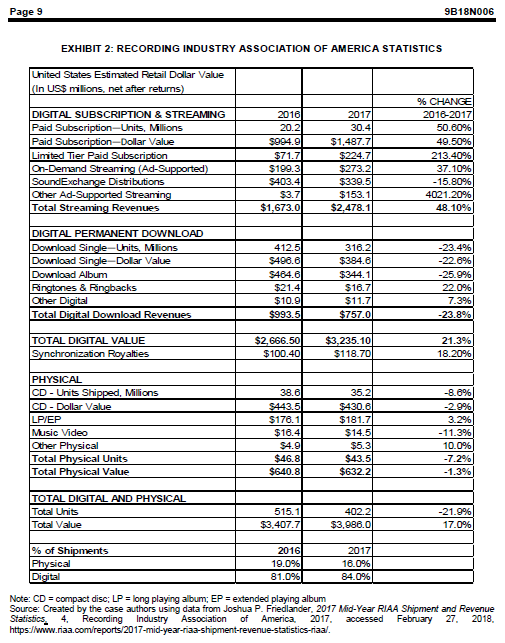
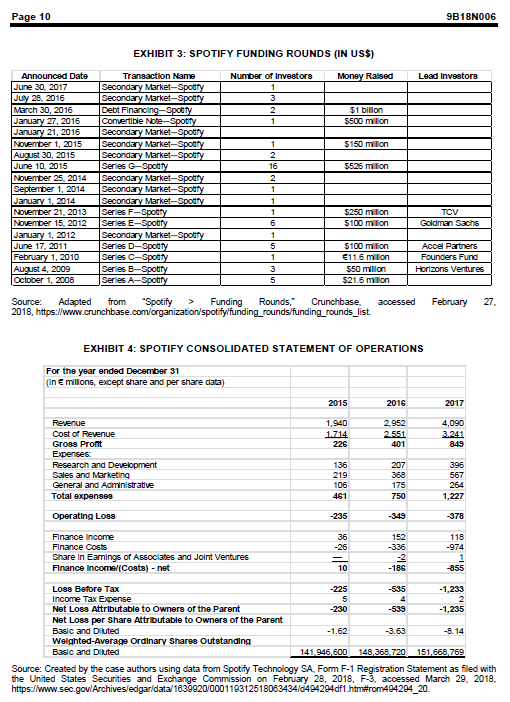
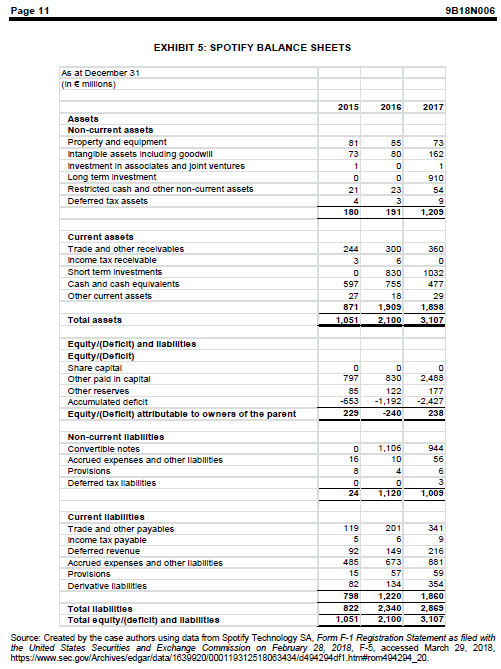
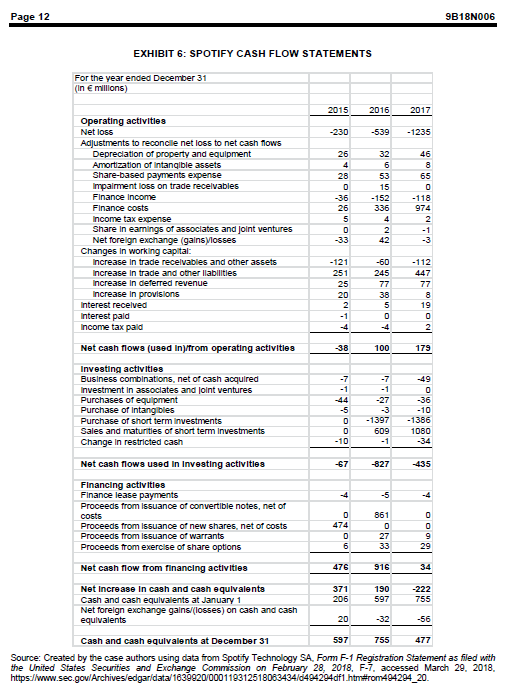
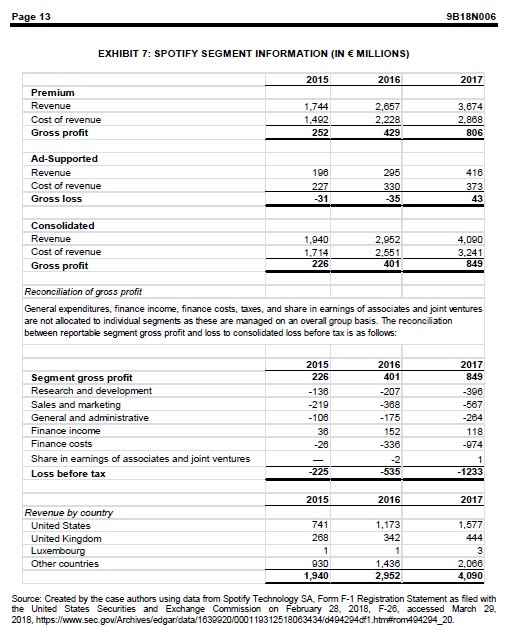
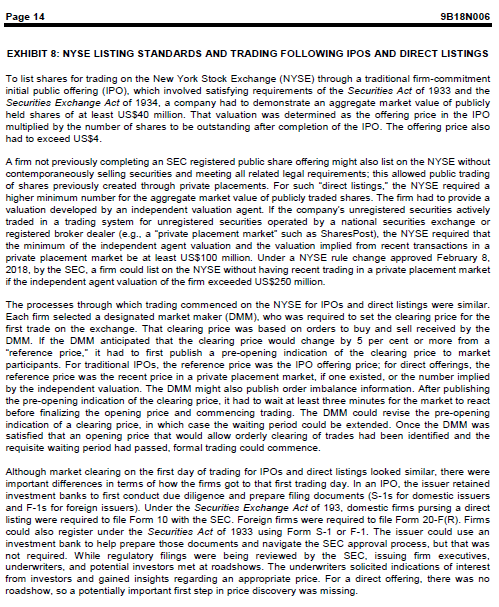
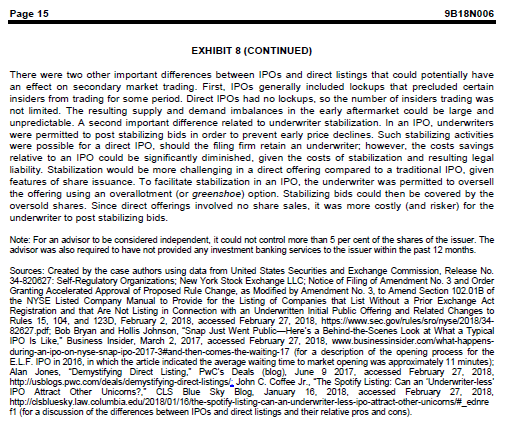
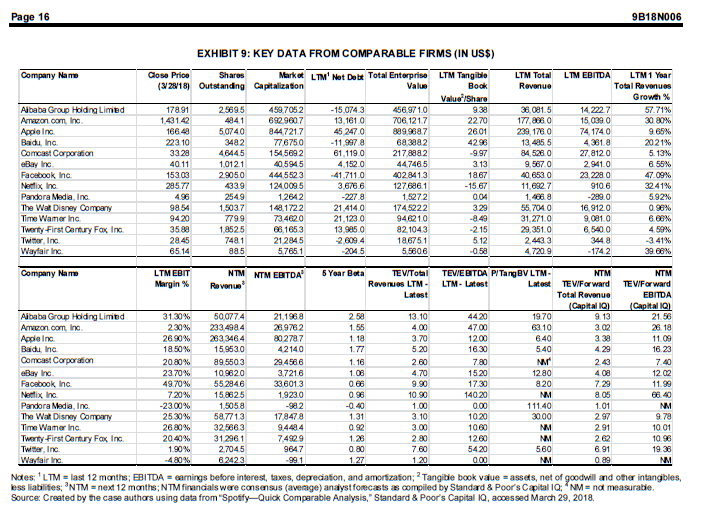
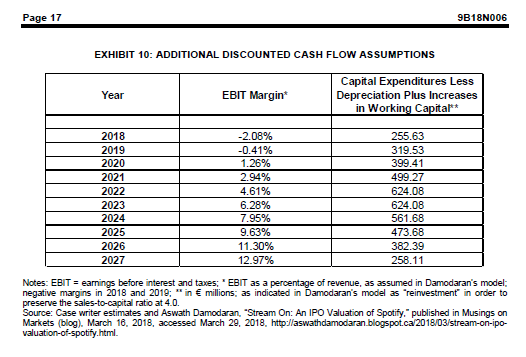
Ivey Publishing W18228 SPOTIFY'S DIRECT-LISTING IPOH Ken Mark wrote this case under the supervision of Professors Craig Dunbar and Stephen Foerster solely to provide material for class discussion. The authors do not intend to llustrate elther effective or ineffective handling of a managerial situation. The authors may have disguised certain names and other identifying information to protect confidentialty This publication may not be transmitted, photocopied, digitized, or otherwise reproduced in any form or by any means without the permission of the copyright holder. Reproduction of this material is not covered under authorization by any reproduction rights organization. To order coples or request permission to reproduce materials, contact Ivey Publishing, Ivey Business School, Western University, London, Ontario, Canada, NOG ONT; () 519-601.3208; (e) cases@lvey.ca; www.Iveycases.com Copyright 2018 Ivey Business School Foundation Version: 2018-06-22 On the moming of April 3, 2018, Jennifer Wang, a portfolio manager with the hedge fund Super Tech, which focused on growing technology companies, was contemplating an investment in music streaming service Spotify Technology SA (Spotify). The company had planned an unusual direct listing that day on the New York Stock Exchange (NYSE). Unlike typical initial public offerings (IPOs), which used investment banks as underwriters to help firms sell shares in their transition to becoming public companies, Spotify's direct listing would instead have simply made the company's shares eligible for public trading on an exchange, but no capital would be raised. Wang wondered whether her fund should invest in Spotify and if so, what maximum price and investment horizon it should accept. She needed to do her own analysis to establish what she felt was a fair value for Spotify's stock, and her task was complicated by recent equity market turmoil. MUSIC STREAMING The music industry included songwriters, performance artists, talent managers, record labels, music broadcast entities (e-g-, terrestrial radio, Internet radio, and television), and the live performance segment. The product-recorded songs developed and recorded by artistswas sources and curated primarily by three major record labels: Sony BMG, Universal Music Group, and Warner Music Group. Together, these three labels controlled 80 per cent of the market for popular music. These labels signed artists and coordinated the process that produced, manufactured, distributed, and marketed artists' performed songs. Songs were marketedintroduced to the publicwhen they were featured on broadcast media. Artists were paid royalties for their songs based on a statutory rate in the United States. Recording artist mechanical royalties were set at US$0.08for each song of five minutes or less in length and $0.0155 per minute for each song that was more than five minutes long. Record labels generally negotiated artist contracts that paid a percentage of this statutory rate (eg, 75 per cent). After various promotional and touring costs, artists could receive a net 10 per cent royalty on physical record sales and 5-8 per cent on sales from Internet downloads. Music Streaming was a way for users to consume audio content without having to download the files to their devices. Typically, music streaming required users to have a streaming application (app) and wireless access to the Internet. Prior to music streaming, users had to download audio files in various formats such as MP3, WMA, or AAC. Unlike downloaded music, music streamed was not saved to a Page 2 9B18N006 user's hard drive. Instead, the audio files were delivered in small packets, buffered, and played almost simultaneously (see Exhibit 1). The major players in the music streaming industry included Spotify, Apple Inc. (Apple), Google LLC (Google); and Amazon.com Inc. (Amazon) (see Exhibit 2). As of February 2018, Spotify had 140 million active users of its free service and an additional 70 million paid subsenbers in 61 countries. Apple had dominated the digital download industry following the launch of its iTunes Store in 2003. In 2015, it launched Apple Music, which offered streaming services to consumers at a price of $9.99 a month for individuals and $14.99 a month for families of up to six users.' It had a catalogue of 45 million songs and was available in 115 countries. As of February 2018, Apple Music had 30 million subscribers in the United States and 36 million globally. It was growing 5 per cent per month in the United States (faster than Spotify's 2 per cent per month) and was expected to surpass Spotify in the U.S. market by the summer of 2018. Google Play Music was Google's music streaming service. It allowed users to listen to customized Intermet radio station streams for free and had a paid service with a 40 million-song library." Google Play Music had about 7 million subscribers in total in July 2017. Google also operated another video and song streaming service: YouTube Red. Both Google Play Music and YouTube Red cost users $10 per month Amazon had two music streaming services Prime Music and Amazon Music Unlimitedwith a combined 16 million paid subscribers. Prime Music, available to Amazon's Prime members, allowed users to stream over two million songs without ads. Amazon Music Unlimited had tens of millions of songs in its library and was available to Prime members for $7.99 a month and to other customers at $9.99 a month. 12 SPOTIFY'S BACKGROUND Daniel Ek and Martin Lorentzon founded Spotify on April 23, 2006, in Stockholm, Sweden. They launched the public beta version of the Spotify music streaming site in the spring of 2007," and the company was officially launched on October 7, 2008. Ek was the firm's founder and chief executive officer (CEO), and Lorentzon was its co-founder and chair of the board. Other key executives included Barry McCarthy, the chief financial officer, Chris Maples, the managing director of UK operations; and Kate Vale, the managing director and sales director for Australia and New Zealand. In August 2009, 14 when Spotify was valued at $250 million and had 75 employees, its owners included Bolag Andel Rosello (Lorentzon), which held 28.6 per cent; Instructus (Ek) at 23.3 per cent; Northzone Ventures at 11.9 per cent; Enzymix Systems (F. Hago) at 5.8 per cent; Sony BMG at 5.8 per cent; Universal Music at 4.8 per cent: Wamer Music at 3.8 per cent; Wellington IV Tech at 3.8 per cent: Creandum II LP at 3.5 per cent; Swiftie (Strigus) at 2.6 per cent; Creandum II KB at 2.4 per cent; EMI at 1.9 per cent; Merlin at 1.0 per cent; and SBH Capital (B. Hagno) at 0.8 per cent. On February 22, 2018, Spotify revealed that the shareholders of its ordinary shares included Ek (25.7 per cent); Lorentzon (13.2 per cent); Sony Music Entertainment Ltd. (5.7 per cent); entities affiliated with Technology Crossover Ventures (5.4 per cent); Tiger Global Management LLC (6.9 per cent); and Tencent Holdings Limited (7.5 per cent). Spotify's "freemium" business model offered two services to customers. The first was a basic, free-to-use music streaming service with limited functionality (i.e., a limited number of song skips was allowed, the 16 Page 3 9B18N006 sound quality was average, and listeners could not access songs offline) and advertising content interspersed between songs. The premium service was priced at $9.99 a month ($5.00 for students), had higher functionality, and did not contain advertising. This premium service also allowed users to listen to songs offline (ie., to save the songs to their devices) and had enhanced sound quality, with song bitrates increased to 320 kilobits per second." Within the premium service was a family option for up to five members of the same household, priced at $14.99 a month. 18 Spotify paid out 70 per cent of its revenues to copyright holders, principally, the big record labels. Its focus on negotiating and establishing a system for royalty payments set it apart from its major competitors, such as Grooveshark, and allowed it to avoid infringement lawsuits. However, paying out the majority of its revenues in royalties meant that the firm had to continually seek capital as it grew (see Exhibit 3) and that it had never posted a profit. By September 2016, Spotify had paid out a cumulative total of $5 billion in royalties to rights holders, and in June 2017, it announced plans to pay more than $2 billion in guaranteed royalties over the next two years. 19 Acquisitions, Funding, and Financial Performance In March 2014. Spotify purchased The Echo Nest Corporation, a music intelligence firm, for 49.7 million." Echo Nest's capabilities included understanding how users accessed music: it had developed software tools to curate and drive music discovery for users. Other firms Spotify acquired between 2013 and 2017 included Soundtrap AB, Niland API, Mediachain, MightyTV, Sonalytic CrowdAlbum, Seed Scientific, Tunigo, Preact, and Cord Project Inc., each for an undisclosed sum. These acquired firms focused mainly on technology that identified songs and their creators (or rights holders), blockchain data solutions that connected apps to media, and software that created better- quality personalized song recommendations, On March 29, 2016, Spotify announced it was raising $1 billion in convertible debt from a group of investors including the private equity firm TPG, the hedge fund Dragoneer Investment Group LLC, and clients of the Goldman Sachs Group Inc. The annual interest payment on the debt would be 5 per cent per year and would increase by one percentage point every six months until Spotify went public or the rate reached 10 per cent, whichever came first. In addition, the debt was convertible into equity at a 20 per cent discount to Spotify's share price if an IPO were held within a year of the closing of the deal. The discount would continue to increase by 2.5 percentage points every six months after that initial year. Spotify added the $1 billion to its $600 million in cash on hand. Prior to raising this current round of convertible debt, Spotify had raised $1 billion from investors such as Founders Fund; Accel Partners; Technology Crossover Ventures, and Kleiner, Perkins, Caufield and Byers.** In December 2017, private trades in Spotify stock valued the fum at above $19 billion. This was an increase from the $16 billion valuation accorded to Spotify in the fall of 2017. Further, in early December 2017, Tencent Music Entertainment, a subsidiary of the Chinese tech giant Tencent, purchased stock in the firm, valuing Spotify at $20 billion. Some of the Spotify shares in the transaction came from Spotify's convertible debt placement: TPG and Dragoneer were allowed to convert their debt into equity at a $10 billion valuation and then sell it to Tencent at a $20 billion valuation. The amount of debt converted was not made public. 26 According to Spotify's annual income statements, balance sheets, cash flow statements, and segment information (see Exhibits 47), the company generated revenues of 4,090 million in 2017 and had a net loss of 1,233 million. Its revenues had grown 52.2 per cent, from 1,940 in 2015 to 2.952 in 2016, and Page 4 9B18N006 another 38.6 per cent from 2016 to 2017. Its net loss had grown 134.3 per cent, from 230 million in 2015 to 539 million in 2016, and another 129.1 per cent from 2016 to 2017. Disputes and Critics In October 2014. Taylor Swift's album 1980 was missing from Spotify's playlist, and Swift publicly removed the rest of her song catalogue in November 2014. She stated [A]ll I can say is that music is changing so quickly, and the landscape of the music industry itself is changing so quickly, that everything new, like Spotify, all feels to me a bit like a grand experiment. And I'm not willing to contribute my life's work to an experiment that I don't feel fairly compensates the writers, producers, artists, and creators of this music. And I just don't agree with perpetuating the perception that music has no value and should be free. ?> Spotify playfully responded with a promoted playlist entitled "What to Play While Taylor's Away." By June 2017, Swift, seemingly interested in earming some of the royalties being paid to music streaming artists, put her full playlist back on Spotify. A member of another band, Radiohead, had announced in 2013 that "I feel like as musicians we need to fight the Spotify thing," and the band kept its music off of the site. But Radiohead relented, and its music was on Spotify by mid-2016." In late December 2017, Spotify was sued by Wixen Music Publishing Inc. (Wixen). Wixen was alleging that Spotify was using thousands of songs without a license and without compensating the music publisher and was seeking $1.6 billion in damagesor $150,000 per song. According to Wixen, while Spotify had signed deals with the music labels to acquire nights to sound recordings of songs, it had failed to acquire the rights for the song compositions. The Wixen lawsuit would be the fourth outstanding lawsuit against Spotify, and the biggest. Others, by songwriter Bob Gaudio and Bluewater Music Services Corporation, collectively represented a few thousand song compositions and potentially, hundreds of millions of dollars in damages if the maximum of $150,000 for statutory damages were awarded. 2 Spotify had already settled one lawsuit alleging song composition infringement. In May 2017, Spotify paid $43 million to settle a class-action lawsuit initiated by a group of songwriters who had accused the streaming service of using their songs without their permission and failing to pay royalties on the music. There were potentially tens of millions of copyrighted song compositions. In statements it made to the United States Copyright Office. Spotify indicated that it was attempting to locate and identify the owners of these songs. In reaching deals with the major publishers, Spotify relied on Harry Fox Agency to advise it on its compliance on the issue of song licenses. 34 Preparations for Direct Listing In July 2017, Spotify executives met with the U.S. Securities and Exchange Commission to explore the process of going public via an PO (see Exhibit 8). By this time, it had raised $1 billion in a convertible note and had hired three investment banks to assist with the IPO process: Goldman Sachs Group Inc., Morgan Stanley, and Allen & Company LLC." The private discussions progressed, but no IPO was held in 2017. On February 28, 2018, Spotify filed a prospectus to sell shares on the NYSE. Rather than going public via a traditional IPO process, Spotify was planning a direct listing after regulatory filings were approved. There would be no investor road show (1.e., presentations by management to analysts and potential Page 5 9B18N006 ** Spotify investors) before the IPO date, and there would be no quiet period during which analysts, issuers, company insiders, and other parties would be restricted from discussing or promoting the stock. There would also be no stock sales to selected clients coordinated by investment banks. Pundits believed that the major reason Spotify was seeking to list its shares was because of the convertible debt terms. On March 15, the company live-streamed an unusual investor day event that included a playlist of music such as "I'm Waiting for the Man," by The Velvet Underground, which announced the appearance of CEO Ek, and ending with "Closing Time," by Semisonic. Senior executives presented a vision for the company, and the chief financial officer discussed some of the company's financial aspects. prioritized growthparticularly in mobile, podcasts, and cars-over profits in the short term. Spotify positioned itself in the discovery" business, as opposed to the "access" business of its competitors. In order to reach as wide an audience as possible. Spotify said its free, ad-supported tier would remain. According to the head of research and development, this offered "Something for nothing. It's the greatest value proposition in the history of the world." CEO Ek defended the direct listing by claiming, "I think the traditional model for taking a company public isn't a good fit for us.")? It was also revealed that the shares would start trading on April 3. Spotify's listing was already being called a non-IPO, since the company would start trading directly and would not be raising any cash or selling shares in the event. It would pay equity capital market fees of $30 million in total to Goldman Sachs Group Inc., Morgan Stanley, and Allen & Company LLC. These three banks would assist Spotify with the listing. The banks could engage in price stabilization following the listing, but they would not have a so-called greenshoe option, which would have allowed them as underwriters to buy an additional 15 per cent of shares, to facilitate stabilization. The direct listing would also not include a lock-up period for insiders, this meant that selling volume in the early days of secondary trading would be very unpredictable and could be large. Spotify's Valuation Two common approaches to valuing companies included the discounted cash flow (DCF) analysis and the use of market multiples from comparable firms and recent transactions, such as the ratio of enterprise value to earnings before interest, taxes, depreciation, and amortization (EBITDA). Wang needed a list of peers and key data to estimate Spotify's value using multiples analysis from comparable firms (see Exhibit 9). She initially selected firms with a range of sizes and implied values but wondered whether she should narrow the set. DCF analysis started with an estimate of a firm's free cash flows over a set number of years; then, those cash flows were discounted by the firm's cost of capital to arrive at an estimate of the overall firm value. Interest-bearing debt was subtracted to anive at an estimate of the equity value. On March 26, Spotify released guidance that indicated it expected revenue to rise by 22-27 per cent annually in the first quarter of 2018, to between 1.1 billion and 1.15 billion ($1.37 billion to $1.43 billion), and by 20-30 per cent over the full year of 2018, to between 4.9 billion and 5.3 billion ($6.1 billion to $6.6 billion). Commentators noted that sales growth was forecast to decelerate relative to 2017 gowth In estimating Spotify's equity value using DCF analysis, Wang carefully reviewed the popular blog and analysis of well-known New York University professor and valuation expert Aswath Damodaran * She used some of his DCF model assumptions, modified with her own assessment, to estimate free cash flows for the next 10 years. She used the 2017 revenue base of 4,090 million and assumed annual growth of 25 per cent for 2018-2022, followed by growth of 20 per cent in 2023, 15 per cent in 2024, 11 per cent in Page 6 9B18N006 2025, & per cent in 2026, and 5 per cent in 2027. She estimated that Spotify's annual steady-state" growth rate beyond the next 10 years would be 3 per cent, but she wanted to test a growth rate of 5 per cent as part of her sensitivity analysis. To determine a discount rate for her analysis, Wang assumed a market nisk premium of 5 per cent. Because Spotify was not yet being publicly traded, she compiled data on peer firms to determine an appropriate beta (see Exhibit 9). She noted that Spotify did not have any outstanding interest-bearing debt. Given tax-loss carryforwards, she assumed Spotify would not pay any taxes through 2022 and would then face a 25 per cent tax rate. She assumed there were 178.11 million shares outstanding. Among other assumptions (see Exhibit 10), for simplicity, she assumed a valuation date of December 31, 2017 for discounting purposes. 41 44 Economic and Market Conditions The U.S. economy recorded real gross domestic product growth of 2.6 per cent in the fourth quarter of 2017, down from the third-quarter 2017 growth of 3.2 per cent.* The Economist Intelligence Unit forecast growth for the U.S. economy in 2018 and 2019 of 2.3 per cent a year. In January 2018, the Federal Reserve kept its target federal funds rate unchanged at 1.25-1.50 per cent." This move had been expected by the market, pundits expected the Federal Reserve to continue increasing the federal funds rate as inflation rose." In late March 2018, a 10-year U.S. government treasury bond was yielding 2.85 per cent. For comparison, the yields for the other Treasury bonds were as follows: 1.71 per cent for one month; 1.79 per cent for three months; 1.94 per cent for six months; 2.06 per cent for one year; 2.33 per cent for two years; and 2.64 per cent for five years. ** In 2017, the Dow Jones Industrial Average had its best-performing year since 2013, advancing by 25 per cent. The Standard and Poor's (S&P) 500 index gained 19 per cent, and the Nasdaq Stock Market (NASDAQ gained 28 per cent." A pull-back in stocks in early February 2018 saw the Dow Jones briefly fall by more than 10 per cent from its high In late March 2018, the Dow Jones had a price-to- earnings (P/E) ratio of 25.2 versus 21.1 a year earlier. It had a dividend yield of 2.24 per cent versus 2.36 a year earlier. The S&P 500 had a P/E ratio of 24.9 versus 24.5 a year earlier and a dividend yield of 1.93 versus 1.97 a year earlier." The Chicago Board Options Exchange (CBOE) Volatility Index (VIX), a measure of anticipated market volatility, spiked from a muted level of below 10 at the beginning of 2018 to over 37 on February 5, before receding to just below 20 in late March. In 2017, there had been a global rebound in IPO activity, and 374 IPOs had raised $141.4 billion, up from 268 IPOs and $106.3 billion in 2016. PO activity had yet to reach the highs of 2014, when $238.4 billion was raised from 413 issues. ** However, on March 23, 2018, file-sharing service Dropbox Inc. went public and saw its first-day share price increase by 36 per cent on the same day that the S&P 500 dropped 2 per cent and both Facebook and Amazon fell by over 3 per cent." In 2017, Snap Inc., which owned the popular social media app Snapchat, swged 44 per cent above its $17 listing price in the first day of trading, but it had struggled since July of that year to trade above the listing price. THE INVESTMENT DECISION The direct-listing date had anived, and it was decision time for Wang. She was still uncertain about whether her fund should invest in Spotify, particularly given the recent market turmoil. She needed to be comfortable that she would be buying in at a fair price, and she also wondered what the investment horizon should be. Page 7 9B18N006 Wang wondered whether Spotify's direct listing was simply a unique occwrence or whether this IPO might also disrupt the traditional underwriting process, just as Spotify had disrupted the music industry. More immediately, she also wondered what would happen in the short term. Stephen Gandel, writing for Bloomberg, captured investors' uncertainty about how Spotify's shares might trade on its first day when he said, "The shares could plunge, soar, or soar and then plunge, or plunge and soar, or not trade at all because of a mismatch between buyers and sellers.1.50 Early on April 3, 2018, the designated market maker on the NYSE, Citadel Securities LLC, set the "reference price for Spotify's direct listing at $132. In a traditional PO, the reference price was the offering price, but in the case of a direct listing, Citadel selected a reference price based on recent private market transactions and independent valuations (see Exhibit 8). Wang settled down in front of her computer at 9:30 a.m., contemplating whether to place an order Market clearing usually happened fairly quickly, so she knew she only had a bit of time to move ahead if she hoped to get in on the first clearing trade of the day. Given the size of the company and the novelty of the listing process, she suspected market clearing might take longer than expected. By 10:30 a.m., trading had not opened but Citadel Securities had posted an initial bid-ask range of $145-$155. A little after 11:00 am., the range moved up to $150-$160, suggesting that demand was strong. Now Wang wondered whether she should jump in or stay on the sidelines Page 8 9B18N006 EXHIBIT 1: THE EVOLUTION OF MUSIC STREAMING The music streaming industry emerged around 2000 when a streaming format was created using Adobe's Flash application. The universal adoption of Flash meant that users did not need to download proprietary streaming formats based on Windows (Media Player) or Apple (QuickTime) in order to listen to or view streams of content. The first major company to commercialize music streaming was Pandora Internet Radio, an Internet-based radio station and music recommendation service. Later renamed Pandora Media, the company continued to focus on its business model of providing customized but non-interactive Internet radio stations to listeners, earning the majority of its revenues from advertising. One of the earliest firms focused on the current interpretation of music streamingdefined as a service that allowed users to select customized playlists of songs and have the audio files played on their devices in real-time-was Grooveshark, which was launched in March 2006. Grooveshark allowed users to sell their MP3 files to each other via a proprietary peer-to-peer network. By April 2008. Grooveshark allowed users to select and play audio files without downloading an application. One of the biggest issues that Grooveshark and other firms in the nascent industry faced was how to manage copyright infringement issues for music being played. The large record labels such as Universal Music Group. Sony Music Entertainment, and Warner Music Group alleged that Grooveshark allowed its users to upload and share music without paying royalties to copyright holders. Grooveshark was faced with a $17 billion lawsuit in 2011 and was shut down on May 1, 2015. Total industry revenues from recorded music were $4.0 billion for the first half of 2017, up from $3.4 billion in the first half of 2016. Total revenues from streaming music services accounted for 62 per cent of the market in 2017, or $2.5 billion. This was up 48 per cent from the first half of 2016. There were over 30.4 million consumers paying for streaming in the United States, resulting in $1.7 billion in paid streaming subscription revenues for the first half of 2017. This was up from $1.067 billion in the first half of 2016. In the same two periods, digital and customized radio revenues were $493 million and $407 million respectively, and ad-supported, on-demand music streaming revenues were $273 million and $199 million respectively. The standard business model in music streaming was a "freemium" model that saw one group of users receive a free service with limited features and advertising, while other users paid for a premium service that had more features (e.g., users could fast forward or skip songs) and was ad-free. Spotify offered a $10 a month unlimited subscription service. Spotify paid about 70 per cent of total revenues to the record labels and other music rights holders. This equated to about $0.006 and $0.0084 every time a song was streamed. Note: All currency amounts are in US$. Sources: Created by the case authors using data from Mark Harris. What Is Streaming Music?. Lifewire, February 8, 2018. accessed February 27, 2018, https://www.lifewire.com/what-is-streaming-music-2438445: Sam Parr, "How Pandora's Founder Convinced 50 Early Employees to Work 2 Years Without Pay. The Hustle, May 27, 2016, accessed February 27, 2018, https://thehustle.co/pandora-speech: Chris Morrison. "Grooveshark Offers P2P Music Downloads - But Is It Legal? Venturebeat, December 5, 2007, accessed February 27, 2018, https://venturebeat.com/2007/12/05/grooveshark-offers-p2p- music-downloads-but-is-it-legall: Brittany Spanos. "Grooveshark Shuts Down after Eight Years." Rolling Stone. May 1, 2015. accessed February 27, 2018. https://www.rollingstone.com/musicews/grooveshark-shuts-down-after-eight-years- 20150501: Joshua P. Frielander. "News and Notes on 2017: Mid-Year RIAA Revenue Statistics,' Recording Industry Association of America, accessed February 27, 2018. http://www.riaa.com/wp-content/uploads/2017/09/RIAA-Mid-Year- 2017-News-and-Notes2.pdf: "How Is Spotify Contributing to the Music Business? Spotify, November 3, 2014. accessed February 27, 2018, https://wayback.archive-it.org/all/20141103193456/http://www.spotifyartists.com/spotify-explained. Page 9 9B18N006 EXHIBIT 2: RECORDING INDUSTRY ASSOCIATION OF AMERICA STATISTICS United States Estimated Retail Dollar Value (In US$ milions, net after returns) DIGITAL SUBSCRIPTION & STREAMING Paid Subscription-Units, Millions Paid Subscription-Dollar Value Limited Tier Paid Subscription On-Demand Streaming (Ad-Supported) SoundExchange Distributions Other Ad-Supported Streaming Total Streaming Revenues 2016 20.2 $994.9 $71.7 $199.31 $403.4 $3.7 $1,673.0 2017 30.4 $1,487.7 $224.7 $273.2 $339.5 $153.1 $2,478.1 % CHANGE 2016-2017) 50.60% 49.50% 213.40% 37.10% - 15.80% 4021.20% 48.10% DIGITAL PERMANENT DOWNLOAD Download Single-Units, Milions Download Single-Dolar Value Download Album Ringtones & Ringbacks Other Digital Total Digital Download Revenues 412.5 $498.6 $484.6) $21.4 $10.9 $993.5 316.2 $384.8 $344.11 $16.7 $11.7 $757.01 -23.4% -22.6% -25.9% 22.0% 7.3% -23.8% TOTAL DIGITAL VALUE Synchronization Royalties $2,666.50 $100.401 $3,235.10 $118.70 21.3% 18.20% PHYSICAL CD - Units Shipped, Millions CD - Dollar Value LP/EP Music Video Other Physical Total Physical Units Total Physical Value 38.6 $443.5 $178.1 $16.4 $4.9 $46.8 $640.8 35.2 $430,6 $181.7 $14.5 $5.3 $43.5 $632.2 -8.0% -2.9%) 3.2% -11.3% 10.0% -7.2% -1.3% TOTAL DIGITAL AND PHYSICAL Total Units Total Value 515.1 $3.407.7 402.2 $3.986.0 -21.9% 17.0% % of Shipments Physical Digital 2016 19.0% 81.0% 2017 16.0% 84.0% Note: CD = compact disc: LP = long playing album: EP = extended playing album Source: Created by the case authors using data from Joshua P. Friedlander 2017 Mid-Year RIAA Shipment and Revenue Statistics. 4, Recording Industry Association of America 2017 accessed February 27 2018, https://www.riaa.com/reports/2017-mid-year-riaa-shipment-revenue-statistics-riaal. Page 10 9B18N006 EXHIBIT 3: SPOTIFY FUNDING ROUNDS (IN US$) Money Raised Lead Investors Number of Investors 1 3 2 1 $1 billion 5500 milion $150 milion $526 million Announced Date June 30, 2017 July 28, 2016 March 30, 2016 January 27, 2016 January 21, 2016 November 1, 2015 August 30, 2015 June 10, 2015 November 25, 2014 September 1, 2014 January 1, 2014 November 21, 2013 November 15, 2012 January 1, 2012 June 17, 2011 February 1, 2010 August 4, 2009 October 1, 2008 Transaction Name Secondary Market-Spotty Secondary Market-Spotty Debt Financing Spotify Convertible Note-Spotty Secondary Market-Spotty Secondary Market-Spotify Secondary Market-Spoety Series G-Spotify Secondary Market-Spotify Secondary Market - Sporty Secondary Market-Spotify Series F-Spotty Series E-Spotify Secondary Market-Spotify Series D-Spotify Series C-Spotty Series B-Spotty Series A-Spotify 1 2 16 2 1 1 1 6 1 5 1 3 5 $250 milion $100 million TCV Goldman Sachs $100 milion 11.6 million 550 million $21.6 milion Accel Partners Founders Fund Horizons Ventures Source: Adapted from "Spotify Funding Rounds, Crunchbase accessed 2018, https://www.crunchbase.com/organization'spotify funding_rounds/funding_rounds_list. February . 27. EXHIBIT 4: SPOTIFY CONSOLIDATED STATEMENT OF OPERATIONS For the year ended December 31 (in E millons, except share and per share data) 2015 2016 2017 1,940 1.714 226 2.952 2.551 401 4,090 3.241 849 Revenue Cost of Revenue Gross Pront Expenses Research and Development Sales and Marketing General and Administrative Total expenses Operating Loss 136 219 106 207 368 175 750 396 567 264 1,227 461 -235 -378 -186 4 Finance Income 36 152 118 Finance Costs -26 -336 -974 Share in Earnings of Associates and Joint Ventures 1 Finance Incomel (Costs) - net 10 -855 Loss Before Tax -225 -535 -1,233 Income Tax Expense 5 2 Net Loss Attributable to Owners of the Parent -230 -539 -1,235 Net Loss per Share Attributable to Owners of the Parent Basic and Diluted -1.62 -3.63 -8.14 Weighted Average Ordinary Shares Outstanding Basic and Diluted 141.946.600 148,368,720 151,668,769 Source: Created by the case authors using data from Spotify Technology SA. Form F-1 Registration Statement as filed with the United States Securities and Exchange Commission on February 28, 2018, F3. accessed March 29, 2018. https://www.sec.gov/Archives/edgar/data/1630920/000119312518063434/d404294df1.htm#rom494294_20 Page 11 9B18N006 EXHIBIT 5: SPOTIFY BALANCE SHEETS As at December 31 (In E millions) 2015 2016 2017 Assets Non-current assets Property and equipment Intangible assets including goodwill Investment in associates and joint ventures Long term investment Restricted cash and other non-current assets Deferred tax assets 81 73 1 0 21 85 80 0 . 73 162 1 910 54 9 1,209 23 3 191 180 : 360 Current assets Trade and other receivables Income tax receivable Short term Investments Cash and cash equivalents Other current assets 244 3 0 597 27 871 1,051 300 6 8:30 755 18 1.909 2.100 1032 477 29 1,898 3.107 Total assets Equity (Deficit) and llabilities Equity(Deficit) Share capital Other paid in capital Other reserves Accumulated deficit Equity!(Deficit) attributable to owners of the parent 0 797 85 -653 229 0 830 122 -1,192 -240 0 2,488 177 -2.427 238 Non-current liabilities Convertible notes Accrued expenses and other abilities Provisions Deferred tax liabilities 0 16 1,106 10 4 0 1,120 56 6 3 1,009 0 24 Current liabilities Trade and other payables 119 201 341 Income tax payable 5 6 9 Deferred revenue 92 149 216 Accrued expenses and other abilities 485 673 881 Provisions 15 57 59 Derivative labilities 82 134 798 1,220 1,860 Total llabilities 822 2,340 2.869 Total equity (deficit) and liabilities 1.051 2.100 3,107 Source: Created by the case authors using data from Spotify Technology SA, Form F-1 Registration Statement as filed with the United States Securities and Exchange Commission on February 28, 2018, F5. accessed March 29, 2018. https://www.sec.gov/Archives/edgar/data/1830920/000119312518063434/d404294df1.htm#rom494294_20. 354 Page 12 9B18N006 EXHIBIT 6: SPOTIFY CASH FLOW STATEMENTS For the year ended December 31 (In millions) 2015 2016 2017 -230 -539 -1235 46 Operating activities Net loss Adjustments to reconcile net loss to net cash flows Depreciation of property and equipment Amortization of Intangible assets Share-based payments expense Impairment loss on trade receivables Finance Income Finance costs Income tax expense Share in earnings of associates and joint ventures Net foreign exchange (gainsvlosses Changes in working capital: Increase in trade recevables and other assets Increase in trade and other liabilities Increase in deferred revenue Increase in provisions Interest received Interest pald Income tax paid 26 4 28 0 -36 26 5 0 -33 32 6 53 15 - 152 336 4 2 42 65 0 - 118 974 2 -1 -3 -112 447 77 -121 251 25 20 2 - 1 -4 -60 245 77 38 5 0 -4 19 0 2 Net cash flows (used In) from operating activities 38 100 179 -7 - 1 Investing activities Business combinations, net of cash acquired Investment in associates and joint ventures Purchases of equipment Purchase of Intangibles Purchase of short term investments Sales and maturities of short term Investments Change in restricted cash -7 -1 -27 -3 -1397 609 -5 0 0 -10 -49 0 -36 -10 - 1386 1080 -34 -67 -827 -435 -5 -4 Net cash flows used in Investing activities Financing activities Finance lease payments Proceeds from Issuance of convertible notes, net of costs Proceeds from Issuance of new shares, net of costs Proceeds from Issuance of warrants Proceeds from exercise of share options Net cash flow from financing activities 0 474 0 6 861 0 27 33 0 0 9 29 476 916 34 371 206 190 597 -222 755 Net Increase in cash and cash equivalents Cash and cash equivalents at January 1 Net foreign exchange gains/(losses) on cash and cash equivalents 20 -32 -56 597 477 Cash and cash equivalents at December 31 755 Source: Created by the case authors using data from Spotify Technology SA. Form F-1 Registration Statement as filed with the United States Securities and Exchange Commission on February 28, 2018, F-7. accessed March 29, 2018. https://www.sec.gov/Archives/edgar/data/1630920/000119312518063434/d404294df1.htm#rom494294_20. Page 13 9B18N006 EXHIBIT 7: SPOTIFY SEGMENT INFORMATION (IN MILLIONS) 2015 2016 2017 Premium Revenue Cost of revenue Gross profit 1.744 1,492 252 2.657 2.228 429 3,674 2.868 806 Ad-Supported Revenue Cost of revenue Gross loss 196 227 -31 295 330 -35 416 373 43 Consolidated Revenue Cost of revenue Gross profit 1,940 1,714 226 2.952 2,551 401 4,090 3.241 849 Reconciliation of gross profit General expenditures, finance income, finance costs, taxes, and share in earnings of associates and joint ventures are not allocated to individual segments as these are managed on an overal group basis. The reconciliation between reportable segment gross profit and loss to consolidated loss before tax is as follows: Segment gross profit Research and development Sales and marketing General and administrative Finance income Finance costs Share in earnings of associates and joint ventures Loss before tax 2015 226 -136 -219 -106 38 -26 2016 401 -207 -368 - 175 152 -336 -2 -535 2017 849 -390 -567 -264 118 -974 1 -1233 -225 2015 2016 2017 Revenue by country United States United Kingdom Luxembourg Other countries 741 268 1 930 1,940 1.173 342 1 1,436 2,952 1.577 444 3 2.066 4,090 Source: Created by the case authors using data from Spotify Technology SA, Form F-1 Registration Statement as filed with the United States Securities and Exchange Commission on February 28, 2018. F-26. accessed March 29. 2018, https://www.sec.gov/Archives/edgar/data/1639920/0001 193 12518063434/0494294cf1.htm#rom494294_20. Page 14 9B18N006 EXHIBIT 8: NYSE LISTING STANDARDS AND TRADING FOLLOWING IPOS AND DIRECT LISTINGS To list shares for trading on the New York Stock Exchange (NYSE) through a traditional fimm-commitment initial public offering (IPO), which involved satisfying requirements of the Securities Act of 1933 and the Securities Exchange Act of 1934, a company had to demonstrate an aggregate market value of publicly held shares of at least US$40 million. That valuation was determined as the offering price in the IPO multiplied by the number of shares to be outstanding after completion of the IPO. The offering price also had to exceed US$4. A firm not previously completing an SEC registered public share offering might also list on the NYSE without contemporaneously selling securities and meeting all related legal requirements: this allowed public trading of shares previously created through private placements. For such "direct listings," the NYSE required a higher minimum number for the aggregate market value of publicly traded shares. The firm had to provide a valuation developed by an independent valuation agent. If the company's unregistered securities actively traded in a trading system for unregistered securities operated by a national securities exchange or registered broker dealer (e-g.. a "private placement market" such as SharesPost). the NYSE required that the minimum of the independent agent valuation and the valuation implied from recent transactions in a private placement market be at least US$100 million. Under a NYSE rule change approved February 8. 2018, by the SEC, a firm could list on the NYSE without having recent trading in a private placement market if the independent agent valuation of the firm exceeded US$250 million. The processes through which trading commenced on the NYSE for IPOs and direct listings were similar. Each firm selected a designated market maker (DMM), who was required to set the clearing price for the first trade on the exchange. That clearing price was based on orders to buy and sell received by the DMM. If the DMM anticipated that the clearing price would change by 5 per cent or more from a "reference price." it had to first publish a pre-opening indication of the clearing price to market participants. For traditional IPOs, the reference price was the IPO offering price: for direct offerings, the reference price was the recent price in a private placement market, if one existed, or the number implied by the independent valuation. The DMM might also publish order imbalance information. After publishing the pre-opening indication of the clearing price, it had to wait at least three minutes for the market to react before finalizing the opening price and commencing trading. The DMM could revise the pre-opening indication of a clearing price, in which case the waiting period could be extended. Once the DMM was satisfied that an opening price that would allow orderly clearing of trades had been identified and the requisite waiting period had passed, formal trading could commence. Although market clearing on the first day of trading for IPOs and direct listings looked similar, there were important differences in terms of how the firms got to that first trading day. In an IPO, the issuer retained investment banks to first conduct due diligence and prepare filing documents (S-1s for domestic issuers and F-15 for foreign issuers). Under the Securities Exchange Act of 193. domestic firms pursing a direct listing were required to file Form 10 with the SEC. Foreign firms were required to file Form 20-F(R). Firms could also register under the Securities Act of 1933 using Form S-1 or F-1. The issuer could use an investment bank to help prepare those documents and navigate the SEC approval process, but that was not required. While regulatory filings were being reviewed by the SEC, issuing firm executives, underwriters, and potential investors met at roadshows. The underwriters solicited indications of interest from investors and gained insights regarding an appropriate price. For a direct offering, there was no roadshow, so a potentially important first step in price discovery was missing. Page 15 9B18N006 EXHIBIT 8 (CONTINUED) There were two other important differences between IPOs and direct listings that could potentially have an effect on secondary market trading. First, IPOs generally included lockups that precluded certain insiders from trading for some period. Direct IPOs had no lockups, so the number of insiders trading was not limited. The resulting supply and demand imbalances in the early aftermarket could be large and unpredictable. A second important difference related to underwriter stabilization. In an IPO. underwriters were permitted to post stabilizing bids in order to prevent early price declines. Such stabilizing activities were possible for a direct IPO, should the filing firm retain an underwriter; however, the costs savings relative to an IPO could be significantly diminished, given the costs of stabilization and resulting legal liability. Stabilization would be more challenging in a direct offering compared to a traditional IPO. given features of share issuance. To facilitate stabilization in an IPO, the underwriter was permitted to oversell the offering using an overallotment (or greenshoe) option. Stabilizing bids could then be covered by the oversold shares. Since direct offerings involved no share sales, it was more costly (and risker) for the underwriter to post stabilizing bids. Note: For an advisor to be considered independent, it could not control more than 5 per cent of the shares of the issuer. The advisor was also required to have not provided any investment banking services to the issuer within the past 12 months. Sources: Created by the case authors using data from United States Securities and Exchange Commission, Release No. 34-820627: Self-Regulatory Organizations: New York Stock Exchange LLC; Notice of Filing of Amendment No. 3 and Order Granting Accelerated Approval of Proposed Rule Change, as Modified by Amendment No. 3. to Amend Section 102.01B of the NYSE Listed Company Manual to provide for the Listing of Companies that List Without a Prior Exchange Act Registration and that Are Not Listing in Connection with an Underwritten Initial Public Offering and Related Changes to Rules 15. 104. and 123D. February 2, 2018, accessed February 27, 2018 https://www.sec.gov/rules/sroyse/2018/34. 82627.pdf. Bob Bryan and Hollis Johnson. "Snap Just Went Public-Here's a Behind-the-Scenes Look at what a Typical IPO Is Like, Business Insider, March 2, 2017, accessed February 27, 2018, www.businessinsider.com/what-happens- during-an-ipo-on-nyse-snap-ipo-2017-3#and-then-comes-the-waiting-17 (for a description of the opening process for the E.LF IPO in 2016, in which the article indicated the average waiting time to market opening was approximately 11 minutes): Alan Jones. "Demystifying Direct Listing. PwC's Deals (blog). June 9 2017. accessed February 27, 2018, http://usblogs.pwc.com/deals/demystifying-direct-listings/ John C. Coffee Jr., "The Spotify Listing: Can an 'Underwriter-less' IPO Attract Other Unicorns? CLS Blue Sky Blog January 16, 2018, accessed February 27. 2018, http://clsbluesky.law.columbia.edu/2018/01/16/the-spotify-listing-can-an-underwriter-less-ipo-attract-other-unicoms#_ednre f1 (for a discussion of the differences between IPOs and direct listings and their relative pros and cons). Page 16 9B18N006 EXHIBIT 9: KEY DATA FROM COMPARABLE FIRMS (IN US$) Company Name Close Price Sharos Market LTM' Not Dots Total Enterprise (3/28/18) Outstanding Capitalization Value LTM Total Revenue Alibaba Group Holding Limed Amazon.com, Inc Apple Inc Baidu, Inc Comcast Corporation eBay Inc Facebook Inc Neelix Inc Pandora Media, Inc The Wat Disney Company Time Waterina Twenty First Century Fox Inc Twitter Inc Wayfair Inc 178.91 1.43142 166 49 223.10 3328 40.11 153.03 285.77 4.96 98 54 9420 3589 28 45 65.14 2.5895 4941 5,0740 3482 46445 10121 2.9050 4339 2549 1.503.7 7799 1.8525 7481 aa 5 459,7052 692.960 7 844.721.7 77,6750 1545692 405945 4445523 124009.5 12642 148.1722 73.4620 66 165 3 212845 5.765.1 - 15.0743 13 1610 45 247.0 - 11 907 8 61,119,0 4.1520 -417110 3.676.6 -2278 21.414.0 21 1230 13.9050 2 6094 -204.5 456.971.0 706.12 1.7 899.9687 683882 217,8382 447465 402 8413 127.686.1 1.5272 1745222 946210 82.1043 18 6751 5,5606 LTM Tangible Book Valuo Share 938 22.70 2601 4296 -9.97 3.13 1a 67 - 15.67 0.04 3.29 -249 -2.15 5.12 -0.58 36 081.5 177 8080 239 1760 13 495 5 84 5260 9567.0 40.653.0 11.692.7 1.4068 55,7040 31,2710 29,351.0 2.4433 4.720.9 LTM EBITDA LTM 1 Year Total Revenues Growth % 14.222.7 57.71% 15.039 0 30 80% 74 1740 9.65% 4.361.8 20 21% 27.8120 5.13% 2.941.0 6.55% 23 2280 47.09% 9106 32.41% -2890 5.92% 16.9120 0.96% 9,0810 6 80% 65400 4.59% 3448 -3.41% -1742 39.68% Company Name LTM EBIT NTM NTM EBITDA 5 Year Bota TEV Total TEVE BITDA P/TangBVLTM- NTM NTM Margin% Revenue Revenues LTM- LTM - Latest Latest TE VI Forward TE VI Forward Latest Total Revenue EBITDA Capital 101 (Capital 101 Alibaba Group Holding Limited 31.30% 50.077.4 21.1968 2.50 13.10 4420 1970 9 13 21.56 Amezzon.com, Inc 2 30% 233498 4 26.9762 1.55 4.00 4700 63.10 3.02 26.10 Apple Inc 26.90% 263.346 4 802787 1.18 3.70 12.00 640 330 11.09 Baidu, Ina 1a 50% 15.9530 42140 1.77 5.20 16.30 5.40 4.29 16.23 Comcast Corporation 20 80% 89 5503 29.4566 1.16 2.60 7.80 NMT 243 7.40 eBay Inc 23.70% 10.9820 3.7216 1.08 4.70 15.20 12 80 4.08 12.02 Facebook Inc 49.70% 55 2846 33 6013 0.66 9.90 17.30 820 7.29 11.99 Neelix Inc 7 20% 15.8625 1.923.0 0.96 10.90 140 20 NM 8.05 06.40 Pandora Media, Inc -23.00% 1.505.8 -982 1.00 0.00 111.40 1.01 NM The Wat Disney Company 25 30% 58.7713 178478 1.31 3.10 1020 3000 2.97 9.78 Time Wamer Inc 26. 80% 32.5663 9.4484 0.92 3.00 10.60 NM 2.91 10.01 Twenty First Century Fox Inc 20.40% 312961 7.4929 1.26 2 80 12 60 NM 262 10.96 Twitter, Inc 1.90% 2.7045 9647 0.80 7.60 5420 560 6.91 1938 Warfaring -480% 6.2423 1.22 1.20 NM 0.89 NM Notes: "LTM = last 12 months: EBITDA = camnings before interest, taxes, depreciation, and amortization; ? Tangible book value = assets, net of goodwill and other intangibles, less liabilifes; NTM = next 12 months; NTM financials were consensus (average) analyst forecasts as compiled by Standard & Poor's Capital IQNM= not measurable. Source: Created by the case authors using data from "Spotify-Quick Comparable Analysis, Standard & Poor's Capital 10, accessed March 29, 2018 000 Page 17 9B18N006 EXHIBIT 10: ADDITIONAL DISCOUNTED CASH FLOW ASSUMPTIONS Year EBIT Margin Capital Expenditures Less Depreciation Plus Increases in Working Capital* 2018 2019 2020 2021 2022 2023 2024 2025 2026 2027 -2.08% -0.41% 1.26% 2.94% 4.61% 6.28% 7.95% 9.63% 11.30% 12.97% 255.63 319.53 399.41 499.27 624.08 624.08 561.68 473.68 382.39 258.11 Notes: EBIT = earnings before interest and taxes: EBIT as a percentage of revenue, as assumed in Damodaran's model: negative margins in 2018 and 2019: "in millions: as indicated in Damodaran's model as 'reinvestment in order to preserve the sales-to-capital ratio at 4.0. Source: Case writer estimates and Aswath Damodaran. "Stream On: An IPO Valuation of Spotify," published in Musings on Markets (blog). March 18, 2018, accessed March 29, 2018, http://aswathdamodaran.blogspot.ca/2018/03/stream-on-ipo- valuation-of-spotify.html. Ivey Publishing W18228 SPOTIFY'S DIRECT-LISTING IPOH Ken Mark wrote this case under the supervision of Professors Craig Dunbar and Stephen Foerster solely to provide material for class discussion. The authors do not intend to llustrate elther effective or ineffective handling of a managerial situation. The authors may have disguised certain names and other identifying information to protect confidentialty This publication may not be transmitted, photocopied, digitized, or otherwise reproduced in any form or by any means without the permission of the copyright holder. Reproduction of this material is not covered under authorization by any reproduction rights organization. To order coples or request permission to reproduce materials, contact Ivey Publishing, Ivey Business School, Western University, London, Ontario, Canada, NOG ONT; () 519-601.3208; (e) cases@lvey.ca; www.Iveycases.com Copyright 2018 Ivey Business School Foundation Version: 2018-06-22 On the moming of April 3, 2018, Jennifer Wang, a portfolio manager with the hedge fund Super Tech, which focused on growing technology companies, was contemplating an investment in music streaming service Spotify Technology SA (Spotify). The company had planned an unusual direct listing that day on the New York Stock Exchange (NYSE). Unlike typical initial public offerings (IPOs), which used investment banks as underwriters to help firms sell shares in their transition to becoming public companies, Spotify's direct listing would instead have simply made the company's shares eligible for public trading on an exchange, but no capital would be raised. Wang wondered whether her fund should invest in Spotify and if so, what maximum price and investment horizon it should accept. She needed to do her own analysis to establish what she felt was a fair value for Spotify's stock, and her task was complicated by recent equity market turmoil. MUSIC STREAMING The music industry included songwriters, performance artists, talent managers, record labels, music broadcast entities (e-g-, terrestrial radio, Internet radio, and television), and the live performance segment. The product-recorded songs developed and recorded by artistswas sources and curated primarily by three major record labels: Sony BMG, Universal Music Group, and Warner Music Group. Together, these three labels controlled 80 per cent of the market for popular music. These labels signed artists and coordinated the process that produced, manufactured, distributed, and marketed artists' performed songs. Songs were marketedintroduced to the publicwhen they were featured on broadcast media. Artists were paid royalties for their songs based on a statutory rate in the United States. Recording artist mechanical royalties were set at US$0.08for each song of five minutes or less in length and $0.0155 per minute for each song that was more than five minutes long. Record labels generally negotiated artist contracts that paid a percentage of this statutory rate (eg, 75 per cent). After various promotional and touring costs, artists could receive a net 10 per cent royalty on physical record sales and 5-8 per cent on sales from Internet downloads. Music Streaming was a way for users to consume audio content without having to download the files to their devices. Typically, music streaming required users to have a streaming application (app) and wireless access to the Internet. Prior to music streaming, users had to download audio files in various formats such as MP3, WMA, or AAC. Unlike downloaded music, music streamed was not saved to a Page 2 9B18N006 user's hard drive. Instead, the audio files were delivered in small packets, buffered, and played almost simultaneously (see Exhibit 1). The major players in the music streaming industry included Spotify, Apple Inc. (Apple), Google LLC (Google); and Amazon.com Inc. (Amazon) (see Exhibit 2). As of February 2018, Spotify had 140 million active users of its free service and an additional 70 million paid subsenbers in 61 countries. Apple had dominated the digital download industry following the launch of its iTunes Store in 2003. In 2015, it launched Apple Music, which offered streaming services to consumers at a price of $9.99 a month for individuals and $14.99 a month for families of up to six users.' It had a catalogue of 45 million songs and was available in 115 countries. As of February 2018, Apple Music had 30 million subscribers in the United States and 36 million globally. It was growing 5 per cent per month in the United States (faster than Spotify's 2 per cent per month) and was expected to surpass Spotify in the U.S. market by the summer of 2018. Google Play Music was Google's music streaming service. It allowed users to listen to customized Intermet radio station streams for free and had a paid service with a 40 million-song library." Google Play Music had about 7 million subscribers in total in July 2017. Google also operated another video and song streaming service: YouTube Red. Both Google Play Music and YouTube Red cost users $10 per month Amazon had two music streaming services Prime Music and Amazon Music Unlimitedwith a combined 16 million paid subscribers. Prime Music, available to Amazon's Prime members, allowed users to stream over two million songs without ads. Amazon Music Unlimited had tens of millions of songs in its library and was available to Prime members for $7.99 a month and to other customers at $9.99 a month. 12 SPOTIFY'S BACKGROUND Daniel Ek and Martin Lorentzon founded Spotify on April 23, 2006, in Stockholm, Sweden. They launched the public beta version of the Spotify music streaming site in the spring of 2007," and the company was officially launched on October 7, 2008. Ek was the firm's founder and chief executive officer (CEO), and Lorentzon was its co-founder and chair of the board. Other key executives included Barry McCarthy, the chief financial officer, Chris Maples, the managing director of UK operations; and Kate Vale, the managing director and sales director for Australia and New Zealand. In August 2009, 14 when Spotify was valued at $250 million and had 75 employees, its owners included Bolag Andel Rosello (Lorentzon), which held 28.6 per cent; Instructus (Ek) at 23.3 per cent; Northzone Ventures at 11.9 per cent; Enzymix Systems (F. Hago) at 5.8 per cent; Sony BMG at 5.8 per cent; Universal Music at 4.8 per cent: Wamer Music at 3.8 per cent; Wellington IV Tech at 3.8 per cent: Creandum II LP at 3.5 per cent; Swiftie (Strigus) at 2.6 per cent; Creandum II KB at 2.4 per cent; EMI at 1.9 per cent; Merlin at 1.0 per cent; and SBH Capital (B. Hagno) at 0.8 per cent. On February 22, 2018, Spotify revealed that the shareholders of its ordinary shares included Ek (25.7 per cent); Lorentzon (13.2 per cent); Sony Music Entertainment Ltd. (5.7 per cent); entities affiliated with Technology Crossover Ventures (5.4 per cent); Tiger Global Management LLC (6.9 per cent); and Tencent Holdings Limited (7.5 per cent). Spotify's "freemium" business model offered two services to customers. The first was a basic, free-to-use music streaming service with limited functionality (i.e., a limited number of song skips was allowed, the 16 Page 3 9B18N006 sound quality was average, and listeners could not access songs offline) and advertising content interspersed between songs. The premium service was priced at $9.99 a month ($5.00 for students), had higher functionality, and did not contain advertising. This premium service also allowed users to listen to songs offline (ie., to save the songs to their devices) and had enhanced sound quality, with song bitrates increased to 320 kilobits per second." Within the premium service was a family option for up to five members of the same household, priced at $14.99 a month. 18 Spotify paid out 70 per cent of its revenues to copyright holders, principally, the big record labels. Its focus on negotiating and establishing a system for royalty payments set it apart from its major competitors, such as Grooveshark, and allowed it to avoid infringement lawsuits. However, paying out the majority of its revenues in royalties meant that the firm had to continually seek capital as it grew (see Exhibit 3) and that it had never posted a profit. By September 2016, Spotify had paid out a cumulative total of $5 billion in royalties to rights holders, and in June 2017, it announced plans to pay more than $2 billion in guaranteed royalties over the next two years. 19 Acquisitions, Funding, and Financial Performance In March 2014. Spotify purchased The Echo Nest Corporation, a music intelligence firm, for 49.7 million." Echo Nest's capabilities included understanding how users accessed music: it had developed software tools to curate and drive music discovery for users. Other firms Spotify acquired between 2013 and 2017 included Soundtrap AB, Niland API, Mediachain, MightyTV, Sonalytic CrowdAlbum, Seed Scientific, Tunigo, Preact, and Cord Project Inc., each for an undisclosed sum. These acquired firms focused mainly on technology that identified songs and their creators (or rights holders), blockchain data solutions that connected apps to media, and software that created better- quality personalized song recommendations, On March 29, 2016, Spotify announced it was raising $1 billion in convertible debt from a group of investors including the private equity firm TPG, the hedge fund Dragoneer Investment Group LLC, and clients of the Goldman Sachs Group Inc. The annual interest payment on the debt would be 5 per cent per year and would increase by one percentage point every six months until Spotify went public or the rate reached 10 per cent, whichever came first. In addition, the debt was convertible into equity at a 20 per cent discount to Spotify's share price if an IPO were held within a year of the closing of the deal. The discount would continue to increase by 2.5 percentage points every six months after that initial year. Spotify added the $1 billion to its $600 million in cash on hand. Prior to raising this current round of convertible debt, Spotify had raised $1 billion from investors such as Founders Fund; Accel Partners; Technology Crossover Ventures, and Kleiner, Perkins, Caufield and Byers.** In December 2017, private trades in Spotify stock valued the fum at above $19 billion. This was an increase from the $16 billion valuation accorded to Spotify in the fall of 2017. Further, in early December 2017, Tencent Music Entertainment, a subsidiary of the Chinese tech giant Tencent, purchased stock in the firm, valuing Spotify at $20 billion. Some of the Spotify shares in the transaction came from Spotify's convertible debt placement: TPG and Dragoneer were allowed to convert their debt into equity at a $10 billion valuation and then sell it to Tencent at a $20 billion valuation. The amount of debt converted was not made public. 26 According to Spotify's annual income statements, balance sheets, cash flow statements, and segment information (see Exhibits 47), the company generated revenues of 4,090 million in 2017 and had a net loss of 1,233 million. Its revenues had grown 52.2 per cent, from 1,940 in 2015 to 2.952 in 2016, and Page 4 9B18N006 another 38.6 per cent from 2016 to 2017. Its net loss had grown 134.3 per cent, from 230 million in 2015 to 539 million in 2016, and another 129.1 per cent from 2016 to 2017. Disputes and Critics In October 2014. Taylor Swift's album 1980 was missing from Spotify's playlist, and Swift publicly removed the rest of her song catalogue in November 2014. She stated [A]ll I can say is that music is changing so quickly, and the landscape of the music industry itself is changing so quickly, that everything new, like Spotify, all feels to me a bit like a grand experiment. And I'm not willing to contribute my life's work to an experiment that I don't feel fairly compensates the writers, producers, artists, and creators of this music. And I just don't agree with perpetuating the perception that music has no value and should be free. ?> Spotify playfully responded with a promoted playlist entitled "What to Play While Taylor's Away." By June 2017, Swift, seemingly interested in earming some of the royalties being paid to music streaming artists, put her full pl
Step by Step Solution
There are 3 Steps involved in it

Get step-by-step solutions from verified subject matter experts