i need help with my homework
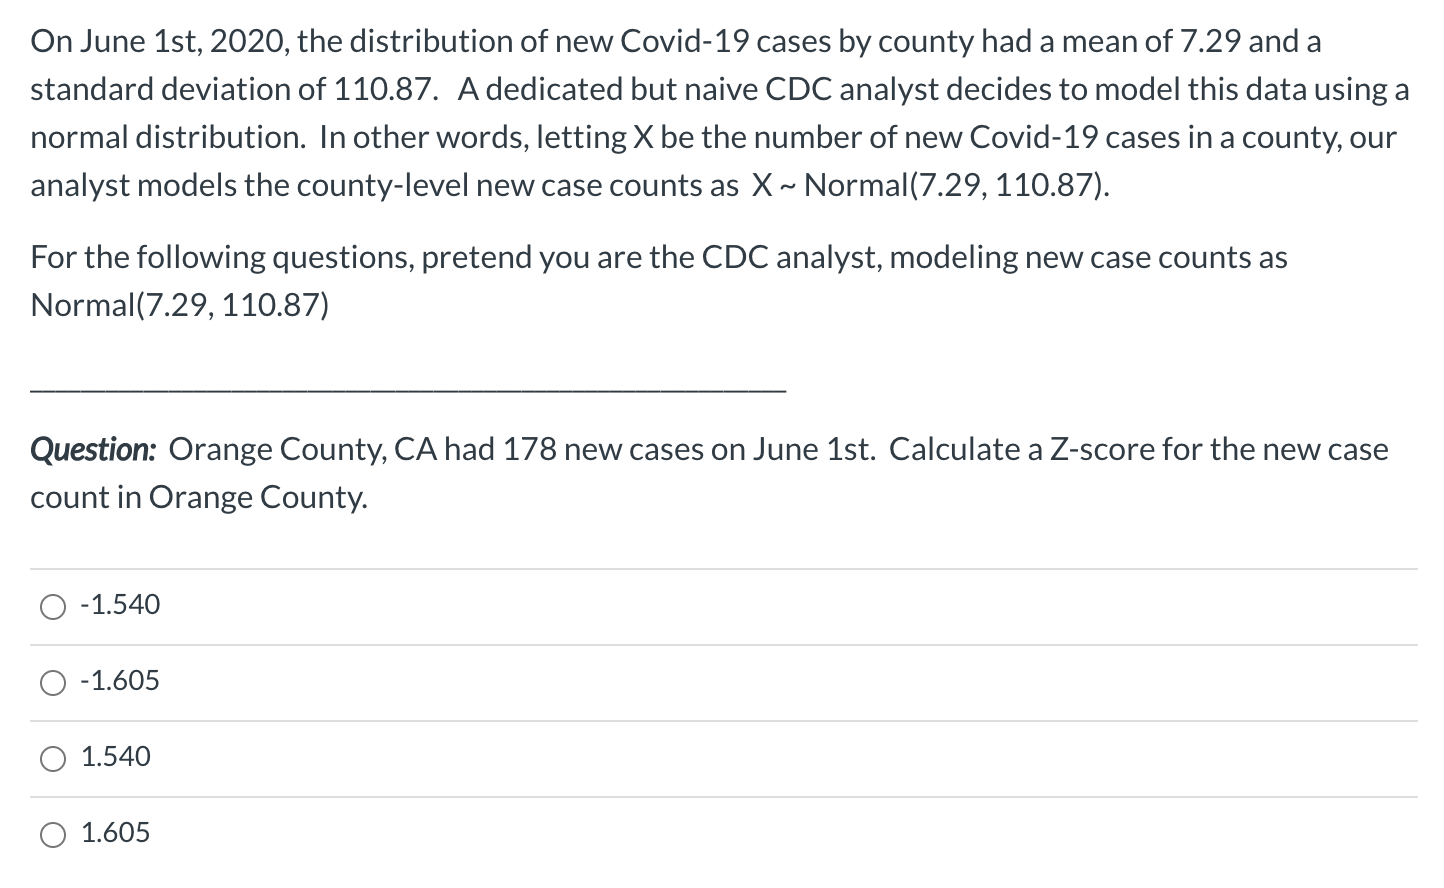
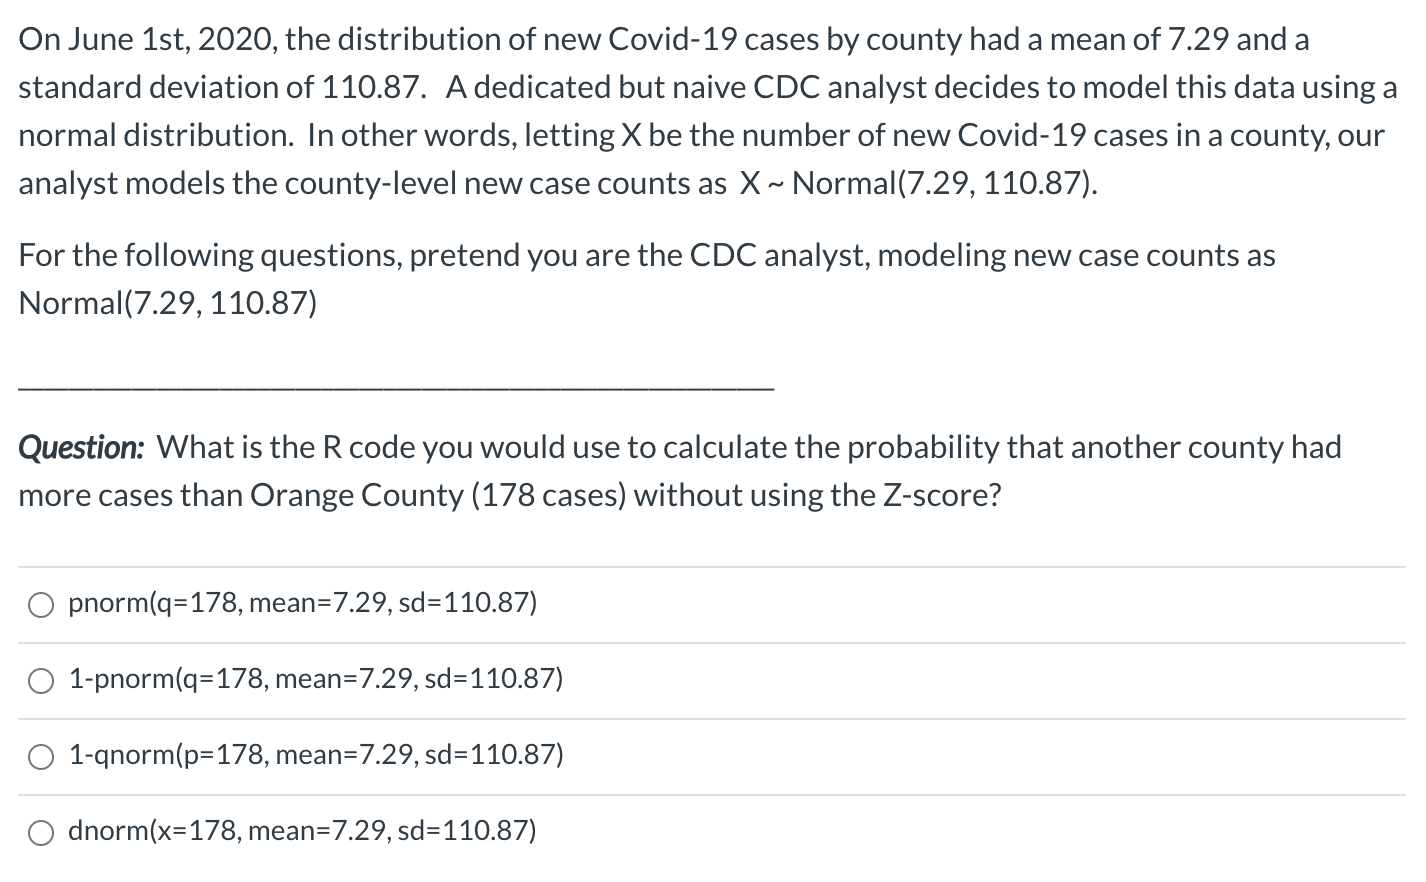
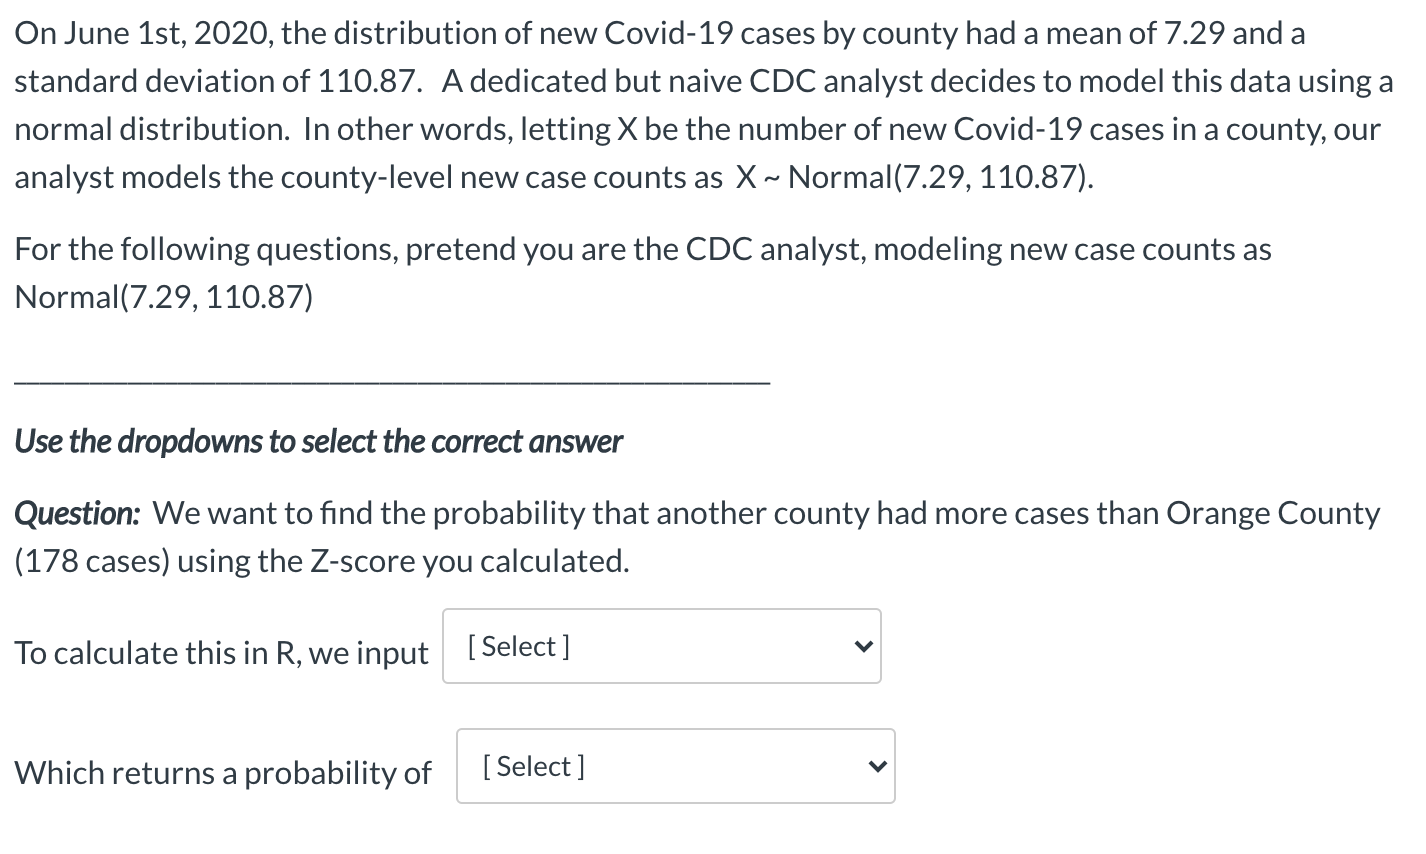
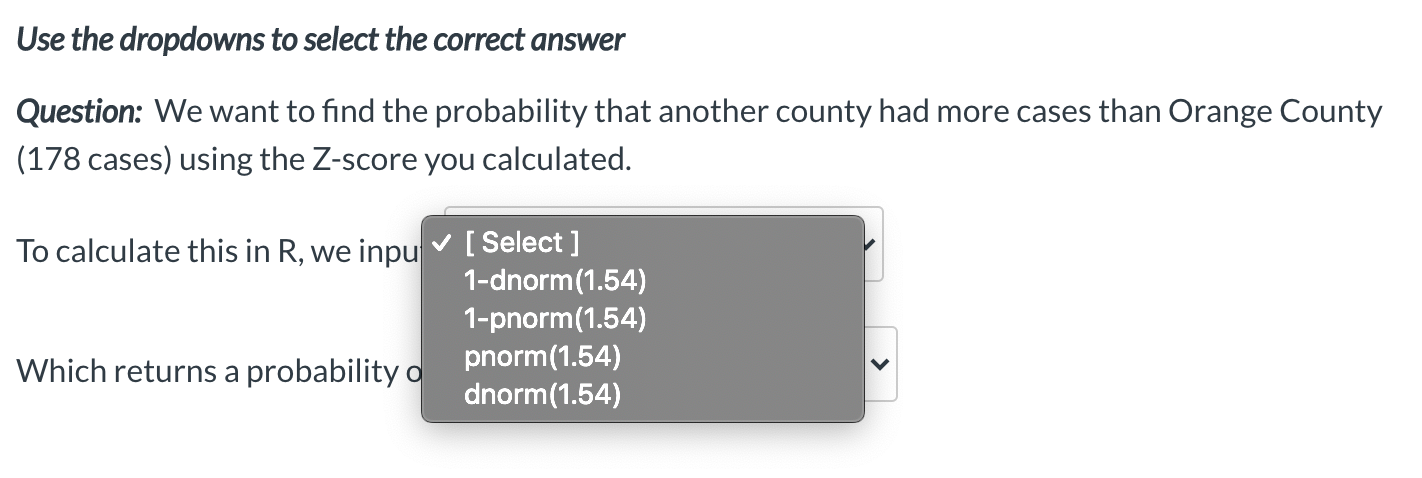
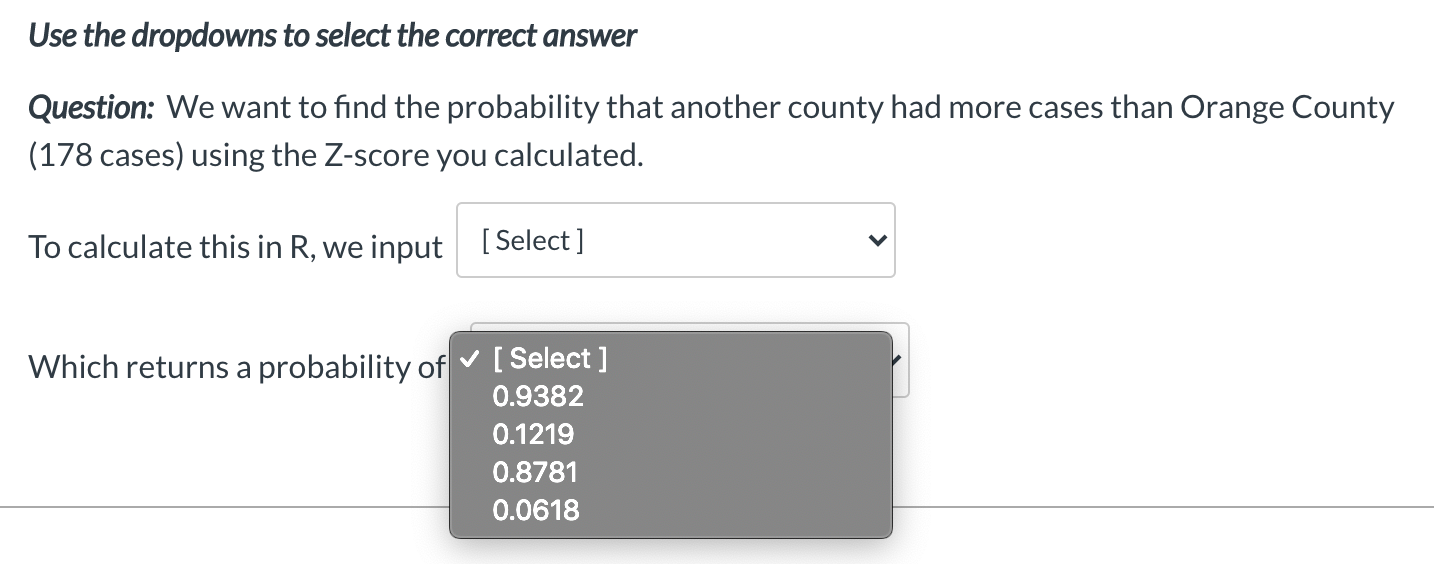
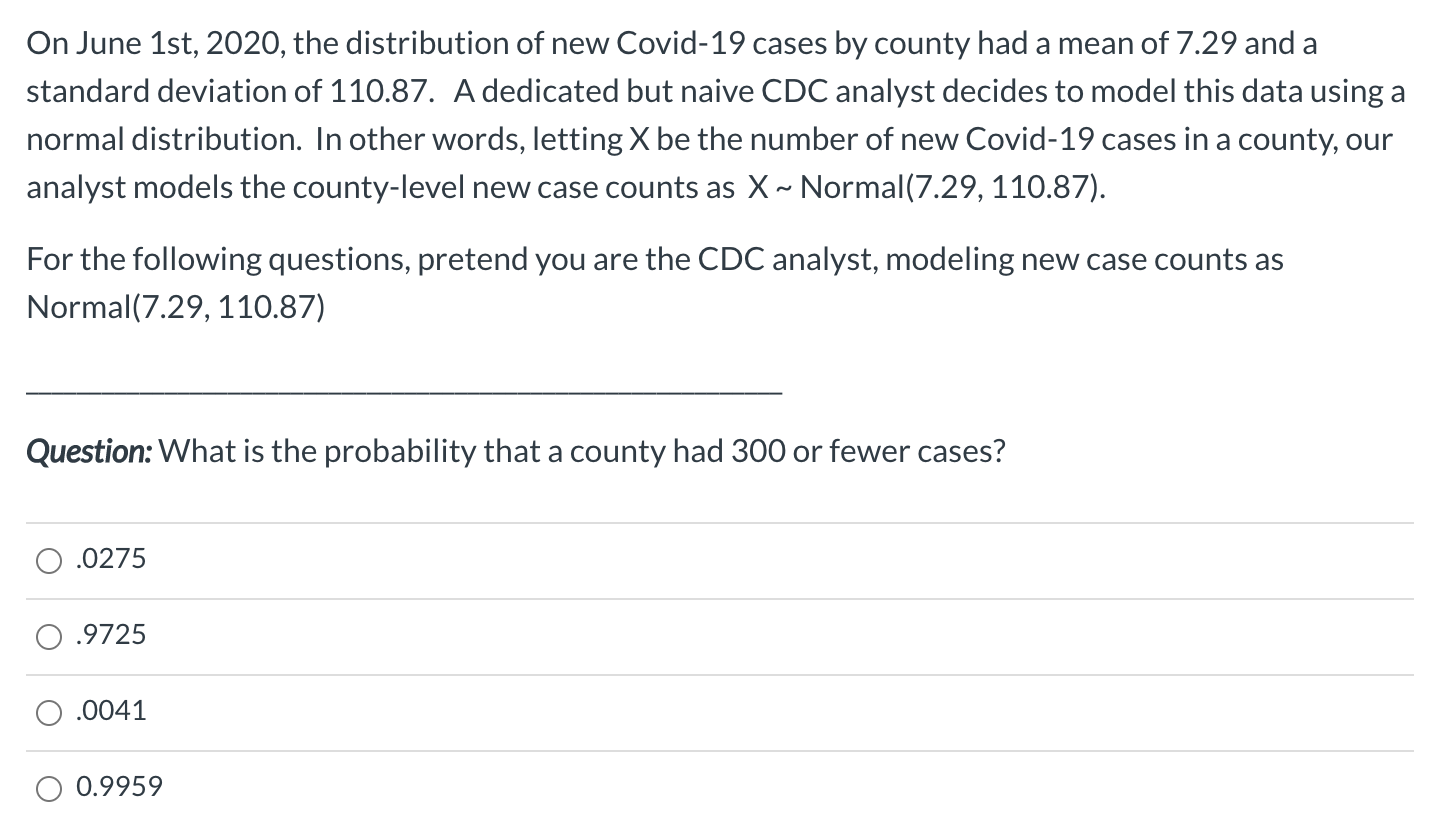
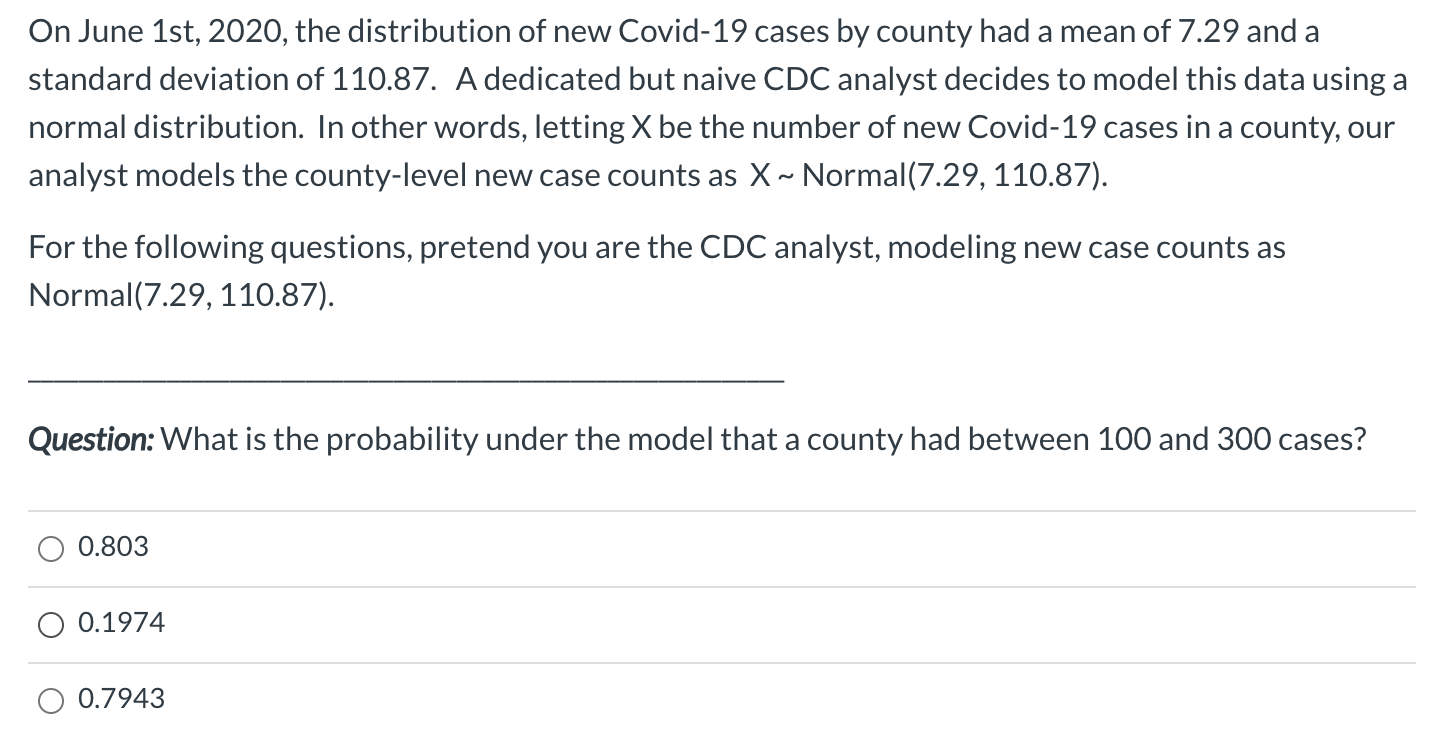
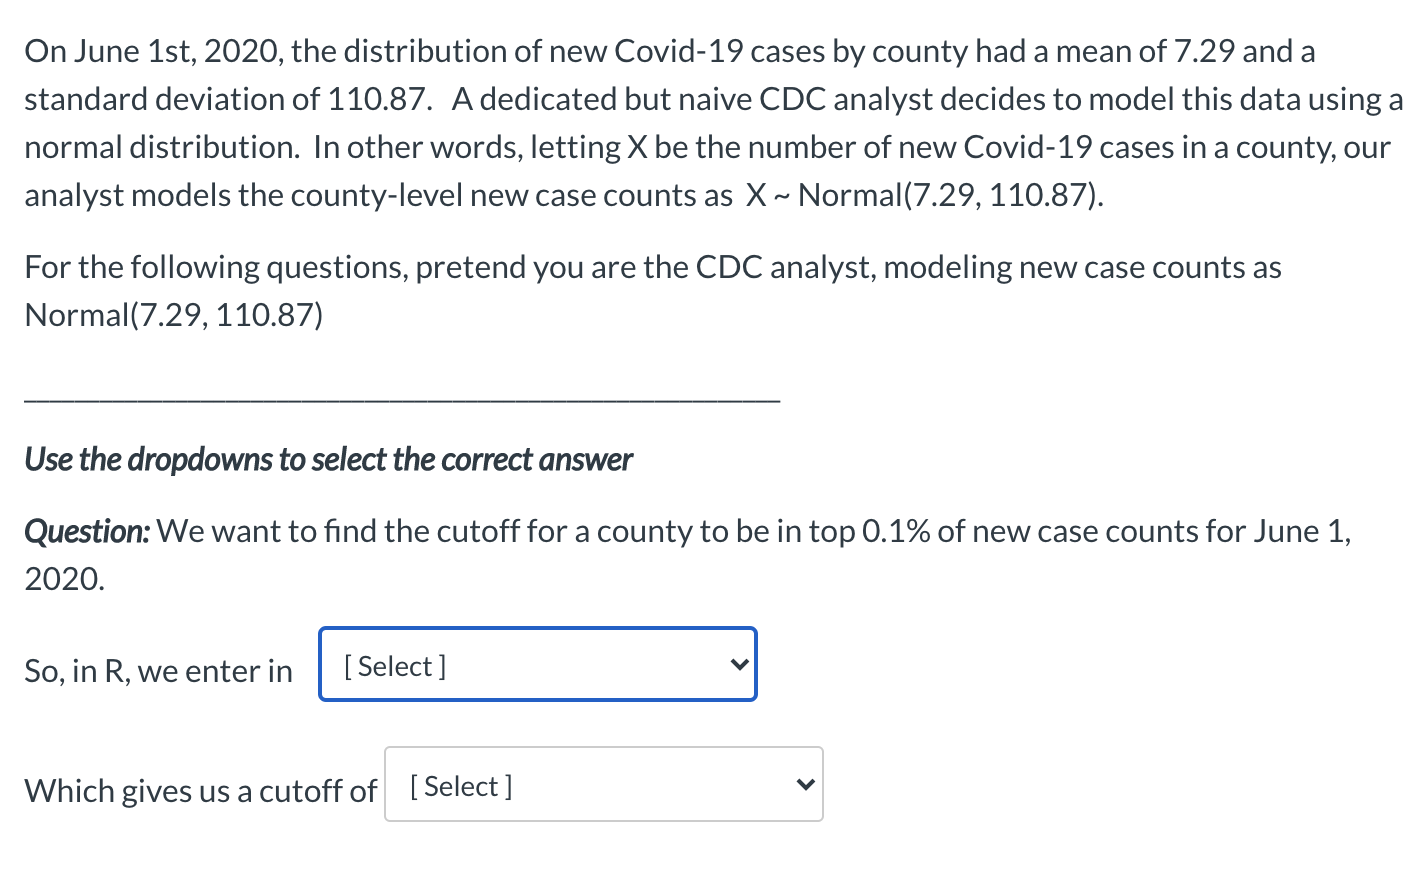
On June lst, 2020, the distribution of new Covid-19 cases by county had a mean of 7.29 and a standard deviation of 110.87. A dedicated but naive CDC analyst decides to model this data using a normal distribution. In other words, letting X be the number of new Covid-19 cases in a county, our analyst models the county-level new case counts as X ~ Normal(7.29, 110.87). For the following questions, pretend you are the CDC analyst, modeling new case counts as Normal(7.29, 110.87) Question: Orange County, CA had 178 new cases on June lst. Calculate a Z-score for the new case count in Orange County. 0 -1.540 O -1.605 O 1.540 O 1.605 On June 1st, 2020, the distribution of new Covid-19 cases by county had a mean of 7.29 and a standard deviation of 110.87. A dedicated but naive CDC analyst decides to model this data using a normal distribution. In other words, letting X be the number of new Covid-19 cases in a county, our analyst models the county-level new case counts as X ~ Normal(7.29, 110.87). For the following questions, pretend you are the CDC analyst, modeling new case counts as Normal(7.29, 110.87) Question: What is the R code you would use to calculate the probability that another county had more cases than Orange County (178 cases) without using the Z-score? O pnorm(q=178, mean=7.29, sd=110.87) 1-pnorm(q=178, mean=7.29, sd=110.87) O 1-qnorm(p=178, mean=7.29, sd=110.87) O dnorm(x=178, mean=7.29, sd=110.87)On June lst, 2020, the distribution of new Covid-19 cases by county had a mean of 7.29 and a standard deviation of 110.87. A dedicated but naive CDC analyst decides to model this data using a normal distribution. In other words, letting X be the number of new Covid19 cases in a county, our analyst models the county-level new case counts as X ~ Normal(7.29, 110.87). For the following questions, pretend you are the CDC analyst, modeling new case counts as Normal(7.29, 110.87) Use the dropdowns to select the correct answer Question: We want to nd the probability that another county had more cases than Orange County (178 cases) using the Zscore you calculated. To calculate this in R, we input [59'9\"] " Which returns a probability of [59'6\"] " Use the dropdowns to select the correct answer Question: We want to find the probability that another county had more cases than Orange County (178 cases) using the Z-score you calculated. To calculate this in R, we inpu v [ Select ] 1-dnorm(1.54) 1-pnorm(1.54) Which returns a probability o pnorm(1.54) V dnorm(1.54)Use the dropdowns to select the correct answer Question: We want to nd the probability that another county had more cases than Orange County (178 cases) using the Zscore you calculated. To calculate this in R, we input Which returns a probability of " [Select] I 0.9382 On June lst, 2020, the distribution of new Covid-19 cases by county had a mean of 7.29 and a standard deviation of 110.87. A dedicated but naive CDC analyst decides to model this data using a normal distribution. In other words, letting X be the number of new Covid-19 cases in a county, our analyst models the countylevel new case counts as X ~ N0rmal(7.29, 110.87). For the following questions, pretend you are the CDC analyst, modeling new case counts as Normal(7.29, 110.87) Question:What is the probability that a county had 300 orfewer cases? ().0275 (3.9725 (3.0041 0 0.9959 On June lst, 2020, the distribution of new Covid-19 cases by county had a mean of 7.29 and a standard deviation of 110.87. A dedicated but naive CDC analyst decides to model this data using a normal distribution. In other words, letting X be the number of new Covid19 cases in a county, our analyst models the county-level new case counts as X ~ Normal(7.29, 110.87). For the following questions, pretend you are the CDC analyst, modeling new case counts as Normal(7.29, 110.87). Question:What is the probability under the model that a county had between 100 and 300 cases? 0 0.803 0 0.1974 0 0.7943 On June lst, 2020, the distribution of new Covid-19 cases by county had a mean of 7.29 and a standard deviation of 110.87. A dedicated but naive CDC analyst decides to model this data using a normal distribution. In other words, letting X be the number of new Covid19 cases in a county, our analyst models the countylevel new case counts as X ~ Normal(7.29, 110.87). For the following questions, pretend you are the CDC analyst, modeling new case counts as Normal(7.29, 110.87) Use the dropdowns to select the correct answer Question: We want to nd the cutoff for a county to be in top 0.1% of new case counts for June 1, 2020. So, in R, we enter in [Select] V Which gives us a cutoff of [Select] V On June lst, 2020, the distribution of new Covid-19 cases by county had a mean of 7.29 and a standard deviation of 110.87. A dedicated but naive CDC analyst decides to model this data using a normal distribution. In other words, letting X be the number of new Covid-19 cases in a county, our analyst models the county-level new case counts as X ~ Normal(7.29, 110.87). For the following questions, pretend you are the CDC analyst, modeling new case counts as Normal(7.29, 110.87). Question: You decide to look at the maximum number of cases in your data. The maximum number of cases on that day was 974 new cases, in LA county. Calculate the Zscore for LA county's new Covid-19 cases. 0 8.719 o 8.785 o -8.785 o -8.719 On June lst, 2020, the distribution of new Covid-19 cases by county had a mean of 7.29 and a standard deviation of 110.87. A dedicated but naive CDC analyst decides to model this data using a normal distribution. In other words, letting X be the number of new Covid-19 cases in a county, our analyst models the countylevel new case counts as X ~ Normal(7.29, 110.87). For the following questions, pretend you are the CDC analyst, modeling new case counts as Normal(7.29, 110.87). Select the 2 (TWO! NO MORE! NO LESS! ONE l5 TOO FEW!) answers that you, the CDC analyst, might reasonably come up with here. Question:What is the probability that the number of new Covid-19 cases in a county on June lst was less than 0? C] 0. Consider. C] pnormlO, mean=7.29, sd=1 10.87) = 0.4738 On June lst, 2020, the distribution of new Covid-19 cases by county had a mean of 7.29 and a standard deviation of 110.87. A dedicated but naive CDC analyst decides to model this data using a normal distribution. In other words, letting X be the number of new Covid-19 cases in a county, our analyst models the county-level new case counts as X ~ Normal(7.29, 110.87). For the following questions, pretend you are the CDC analyst, modeling new case counts as Normal(7.29, 110.87). Note: choosing/eliminating one of the answer choices here will be easier if you've gone over the last two pages of Chapter 8 section 4. Select all answers that apply: Question: You (the CDC analyst) are starting to rethink your model. Why is the Normal distribution probably not a good choice for this data? C] A Normal(7.29, 110.87) would place signicant probability on values below 0, which does not make sense for our data. C] It is never appropriate to model integer-valued data with a Normal distribution. C] Thinking about Question 8's answers makes it clear that the data's actual distribution must be symmetric. C] Thinking about Question 8's answers makes it clear that the data's actual distribution must be very skewed