Answered step by step
Verified Expert Solution
Question
1 Approved Answer
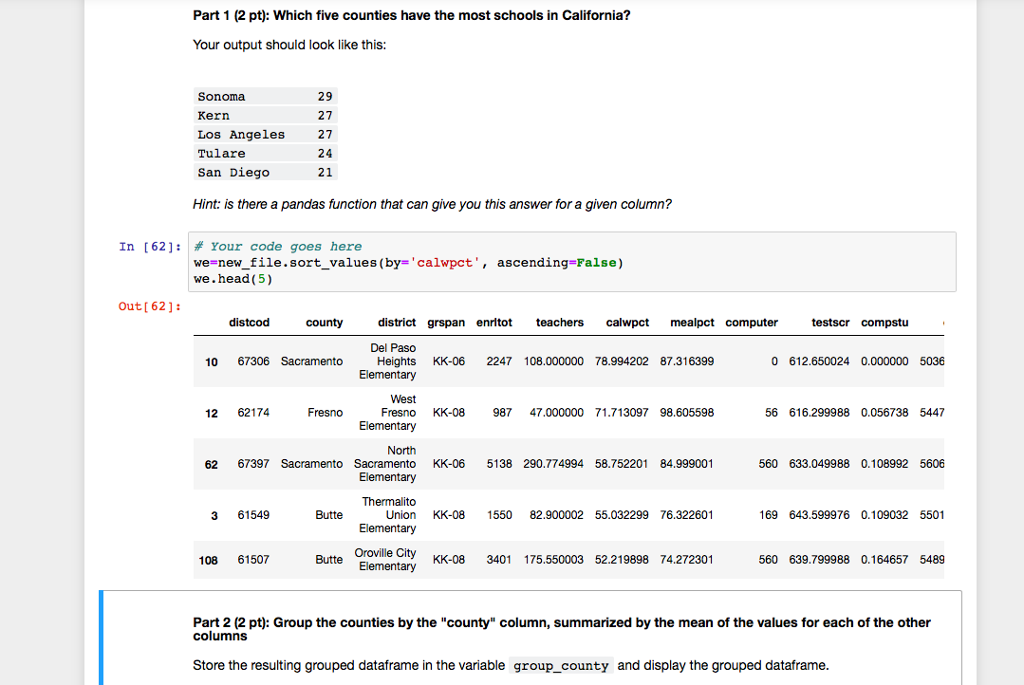
I need help with part 1 and 2 Part 1 (2 pt): Which five counties have the most schools in California? Your output should look
I need help with part 1 and 2


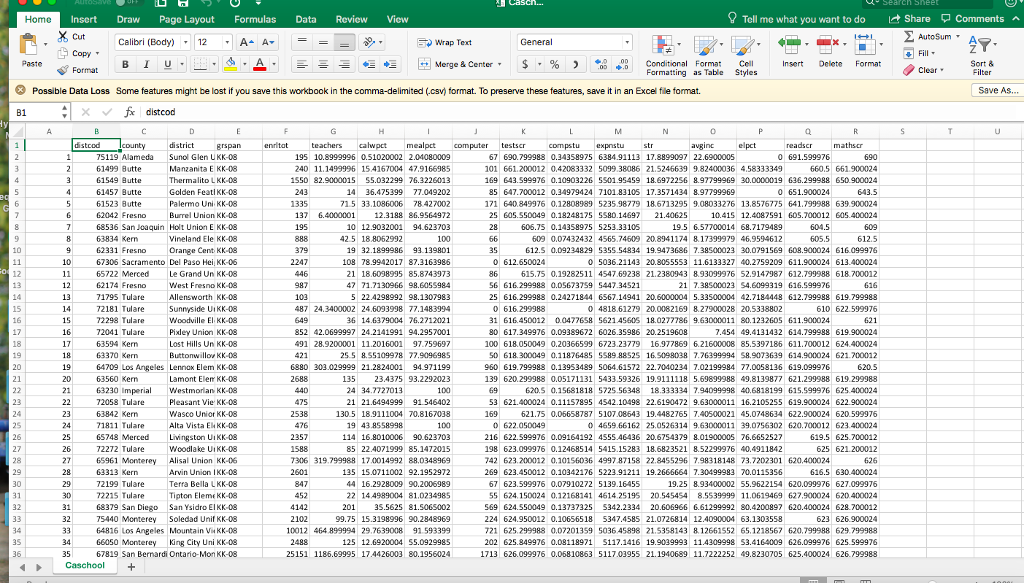
Part 1 (2 pt): Which five counties have the most schools in California? Your output should look like this: Sonoma Kern Los Angeles Tulare San Diego 29 27 27 24 21 Hint: is there a pandas function that can give you this answer for a given column? In [62]: # Your code goes here we-new_file.sort_ values (by- 'calwpct', we.head(5) ascending-False) Out [ 621: distcod county district grspan enrltot teachers calwpct mealpct computer testscr compstu Del Paso Elementary West Elementary North 10 67306 Sacramento Height s KK-06 2247 108.000000 78.994202 87.316399 0 612.650024 0.000000 503 12 62174 Fresno Fresno KK-08 987 47.000000 71.713097 98.605598 56 616.299988 0.056738 5447 62 67397 Sacramento Sacramento KK-06 5138 290.774994 58.752201 84.999001 560 633.049988 0.108992 5606 Thermalito Elementary Butte Oroville City 3 61549 Butte Union KK-08 1550 82.900002 55.032299 76.322601 169 643.599976 0.109032 5501 Elementary KK-08 3401 175550003 52219898 74.27 108 61507 560 639.799988 0.164657 5489 Part 2 (2 pt): Group the counties by the "county" column, summarized by the mean of the values for each of the other columns Store the resulting grouped dataframe in the variable group_county and display the grouped dataframe
Step by Step Solution
There are 3 Steps involved in it
Step: 1

Get Instant Access to Expert-Tailored Solutions
See step-by-step solutions with expert insights and AI powered tools for academic success
Step: 2

Step: 3

Ace Your Homework with AI
Get the answers you need in no time with our AI-driven, step-by-step assistance
Get Started


