Answered step by step
Verified Expert Solution
Question
1 Approved Answer
File Edit View Insert Format Data Tools Help Last edit was 4 hours ago 100% $ % 0.00 123 Default (Ca... 12 fx |


![]()
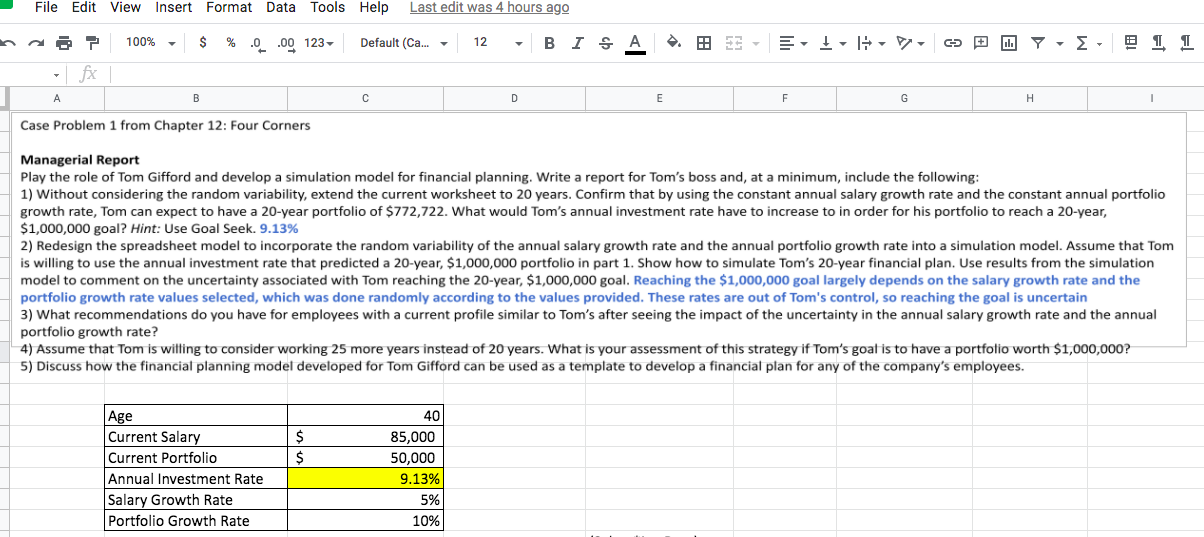
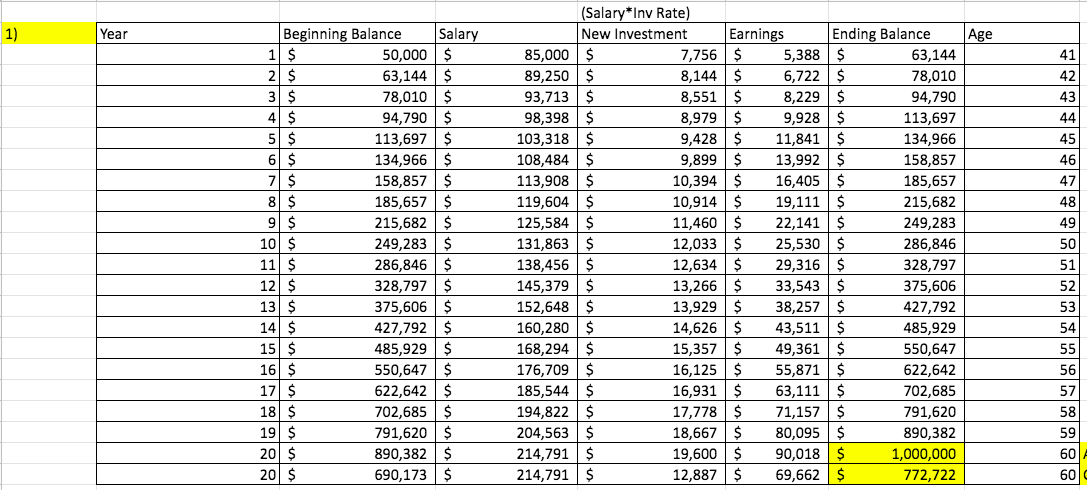
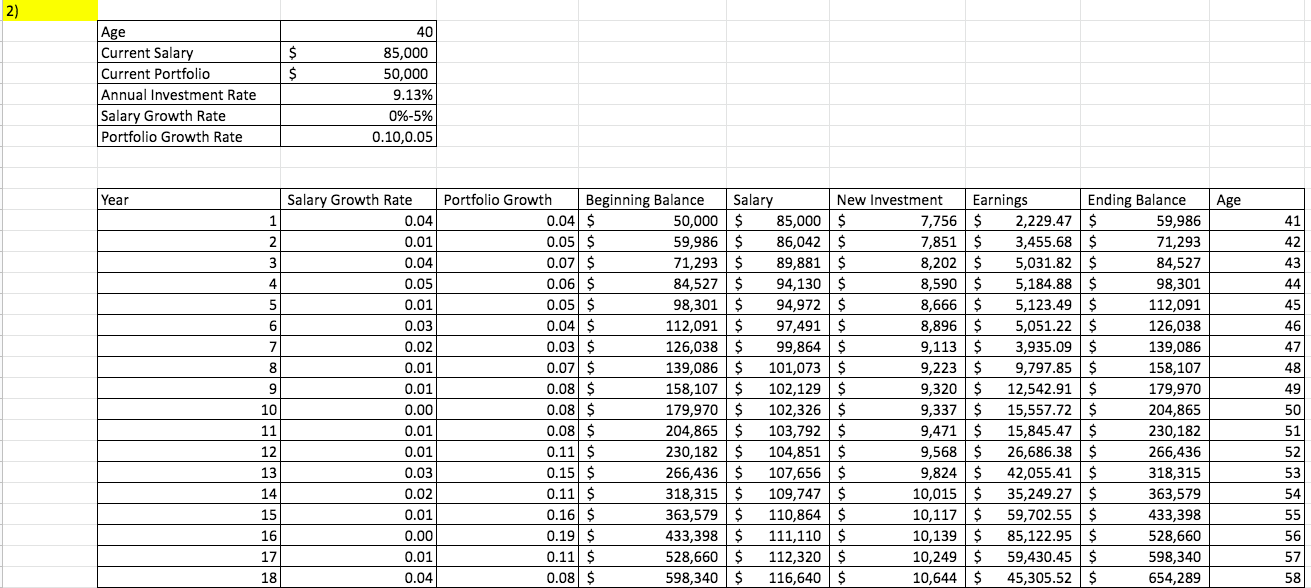
File Edit View Insert Format Data Tools Help Last edit was 4 hours ago 100% $ % 0.00 123 Default (Ca... 12 fx | A B C Case Problem 1 from Chapter 12: Four Corners Managerial Report D BIA B & E F G H 1 1 Play the role of Tom Gifford and develop a simulation model for financial planning. Write a report for Tom's boss and, at a minimum, include the following: 1) Without considering the random variability, extend the current worksheet to 20 years. Confirm that by using the constant annual salary growth rate and the constant annual portfolio growth rate, Tom can expect to have a 20-year portfolio of $772,722. What would Tom's annual investment rate have to increase to in order for his portfolio to reach a 20-year, $1,000,000 goal? Hint: Use Goal Seek. 9.13% 2) Redesign the spreadsheet model to incorporate the random variability of the annual salary growth rate and the annual portfolio growth rate into a simulation model. Assume that Tom is willing to use the annual investment rate that predicted a 20-year, $1,000,000 portfolio in part 1. Show how to simulate Tom's 20-year financial plan. Use results from the simulation model to comment on the uncertainty associated with Tom reaching the 20-year, $1,000,000 goal. Reaching the $1,000,000 goal largely depends on the salary growth rate and the portfolio growth rate values selected, which was done randomly according to the values provided. These rates are out of Tom's control, so reaching the goal is uncertain 3) What recommendations do you have for employees with a current profile similar to Tom's after seeing the impact of the uncertainty in the annual salary growth rate and the annual portfolio growth rate? 4) Assume that Tom is willing to consider working 25 more years instead of 20 years. What is your assessment of this strategy if Tom's goal is to have a portfolio worth $1,000,000? 5) Discuss how the financial planning model developed for Tom Gifford can be used as a template to develop a financial plan for any of the company's employees. Age 40 Current Salary $ 85,000 Current Portfolio $ 50,000 Annual Investment Rate 9.13% Salary Growth Rate 5% Portfolio Growth Rate 10% (Salary*Inv Rate) 1) Year Beginning Balance Salary New Investment Earnings Ending Balance Age 1 $ 50,000 $ 85,000 $ 7,756 $ 5,388 $ 63,144 41 2 $ 63,144 $ 89,250 $ 8,144 $ 6,722 $ 78,010 42 3 $ 78,010 $ 93,713 $ 8,551 $ 8,229 $ 94,790 43 4 $ 94,790 $ 98,398 $ 8,979 $ 9,928 $ 113,697 44 5 $ 113,697 $ 103,318 $ 9,428 $ 11,841 $ 134,966 45 6 $ 134,966 $ 108,484 $ 9,899 $ 13,992 $ 158,857 46 7 $ 158,857 $ 113,908 $ 10,394 $ 16,405 $ 185,657 47 8 $ 185,657 $ 119,604 $ 10,914 $ 19,111 $ 215,682 48 9 $ 215,682 $ 125,584 $ 11,460 $ 22,141 $ 249,283 49 10 $ 249,283 $ 131,863 $ 12,033 $ 25,530 $ 286,846 50 11 $ 286,846 $ 138,456 $ 12,634 $ 29,316 $ 328,797 51 12 $ 328,797 $ 145,379 $ 13,266 $ 33,543 $ 375,606 52 13 $ 375,606 $ 152,648 $ 13,929 $ 38,257 $ 427,792 53 14 $ 427,792 $ 160,280 $ 14,626 $ 43,511 $ 485,929 54 15 $ 485,929 $ 168,294 $ 15,357 $ 49,361 $ 550,647 55 16 $ 550,647 $ 176,709 $ 16,125 $ 55,871 $ 622,642 56 17 $ 622,642 $ 185,544 $ 16,931 $ 63,111 $ 702,685 57 18 $ 702,685 $ 194,822 $ 17,778 $ 71,157 $ 791,620 58 19 $ 791,620 $ 204,563 $ 18,667 $ 80,095 $ 890,382 59 20 $ 890,382 $ 214,791 $ 19,600 $ 90,018 $ 1,000,000 60 20 $ 690,173 $ 214,791 $ 12,887 $ 69,662 $ 772,722 600 2) Age 40 Current Salary $ 85,000 Current Portfolio $ 50,000 Annual Investment Rate 9.13% Salary Growth Rate 0%-5% Portfolio Growth Rate 0.10,0.05 Year Salary Growth Rate Portfolio Growth Beginning Balance Salary New Investment Earnings Ending Balance Age 1 0.04 0.04 $ 50,000 $ 85,000 $ 7,756 $ 2,229.47 $ 59,986 41 2 0.01 0.05 $ 59,986 $ 86,042 $ 7,851 $ 3,455.68 $ 71,293 42 3 0.04 0.07 $ 71,293 $ 89,881 $ 8,202 $ 5,031.82 $ 84,527 43 4 0.05 0.06 $ 84,527 $ 94,130 $ 8,590 $ 5,184.88 $ 98,301 44 5 0.01 0.05 $ 98,301 $ 94,972 $ 8,666 $ 5,123.49 $ 112,091 45 6 0.03 0.04 $ 112,091 $ 97,491 $ 8,896 $ 5,051.22 $ 126,038 46 7 0.02 0.03 $ 126,038 $ 99,864 $ 9,113 $ 3,935.09 $ 139,086 47 8 0.01 0.07 $ 139,086 $ 101,073 $ 9,223 $ 9,797.85 $ 158,107 48 0.01 0.08 $ 158,107 $ 102,129 $ 9,320 $ 12,542.91 $ 179,970 49 10 0.00 0.08 $ 179,970 $ 102,326 $ 9,337 $ 15,557.72 $ 204,865 50 11 0.01 0.08 $ 204,865 $ 103,792 $ 9,471 $ 15,845.47 $ 230,182 51 12 0.01 0.11 $ 230,182 $ 104,851 $ 9,568 $ 26,686.38 $ 266,436 52 13 0.03 0.15 $ 266,436 $ 107,656 $ 9,824 $ 42,055.41 $ 318,315 53 14 0.02 0.11 $ 318,315 $ 109,747 $ 10,015 $ 35,249.27 $ 363,579 54 15 0.01 0.16 $ 363,579 $ 110,864 $ 10,117 $ 59,702.55 $ 433,398 55 16 0.00 0.19 $ 433,398 $ 111,110 $ 10,139 $ 85,122.95 $ 528,660 56 17 0.01 0.11 $ 528,660 $ 112,320 $ 10,249 $ 59,430.45 $ 598,340 57 18 0.04 0.08 $ 598,340 $ 116,640 $ 10,644 $ 45,305.52 $ 654,289 58 19 0.02 0.08 $ 20 0.02 0.14 $ 654,289 $ 718,569 $ 120,917 $ 118,735 $ 10,835 $ 53,445.59 $ 718,569 59 11,034 $103,627.91 $ 833,231 60
Step by Step Solution
There are 3 Steps involved in it
Step: 1
To redesign the spreadsheet model and incorporate random variability follow these steps in Google Sh...
Get Instant Access to Expert-Tailored Solutions
See step-by-step solutions with expert insights and AI powered tools for academic success
Step: 2

Step: 3

Ace Your Homework with AI
Get the answers you need in no time with our AI-driven, step-by-step assistance
Get Started


