I need help with part a,b and c please
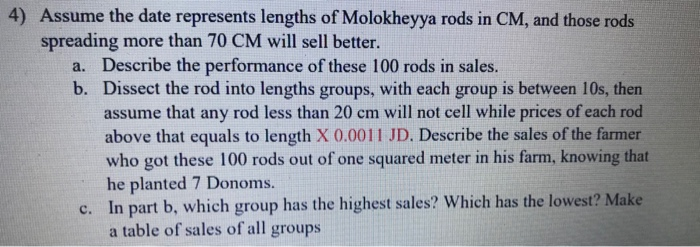
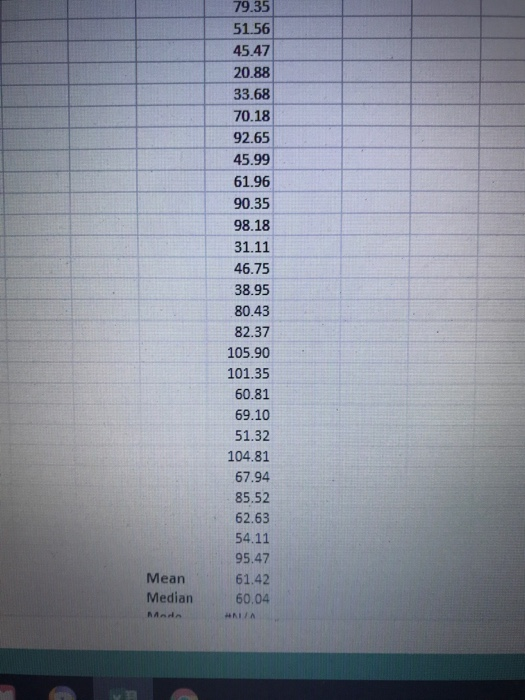
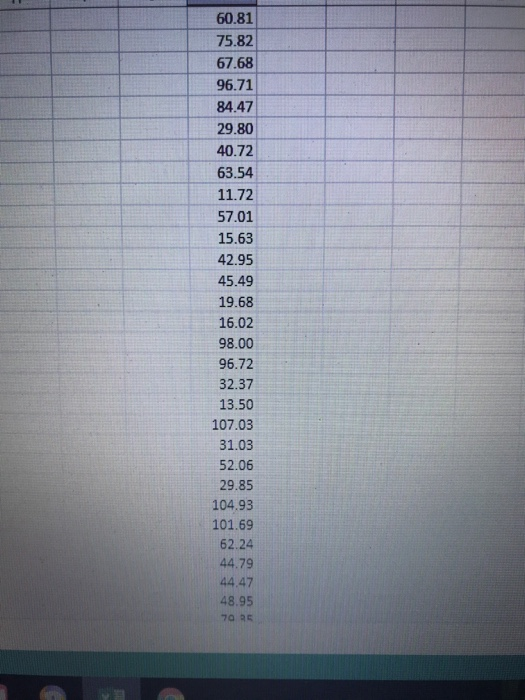
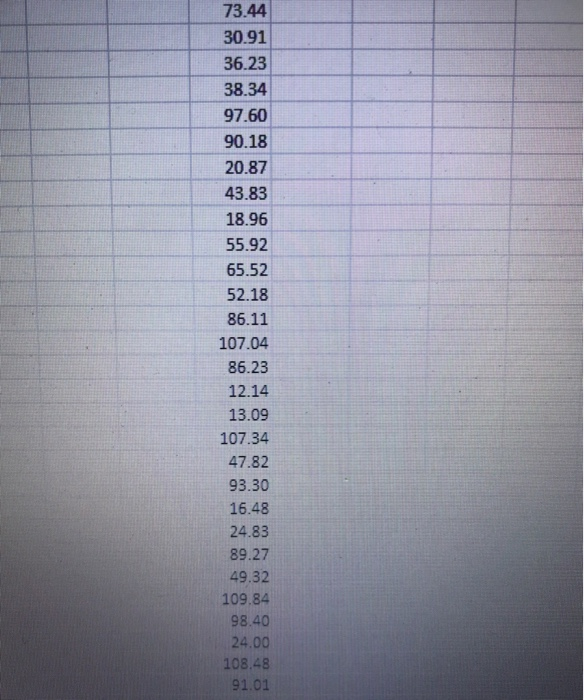
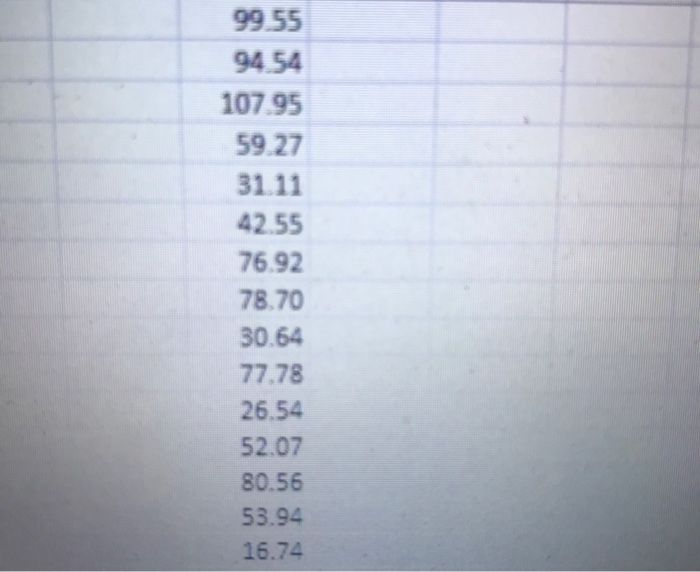
4) Assume the date represents lengths of Molokheyya rods in CM, and those rods spreading more than 70 CM will sell better. a. Describe the performance of these 100 rods in sales. b. Dissect the rod into lengths groups, with each group is between 10s, then assume that any rod less than 20 cm will not cell while prices of each rod above that equals to length X 0.0011 JD. Describe the sales of the farmer who got these 100 rods out of one squared meter in his farm, knowing that he planted 7 Donoms. In part b, which group has the highest sales? Which has the lowest? Make a table of sales of all groups c. 79.35 51.56 45.47 20.88 33.68 70.18 92.65 45.99 61.96 90.35 98.18 31.11 46.75 38.95 80.43 82.37 105.90 101.35 60.81 69.10 51.32 104.81 67.94 85.52 62.63 54.11 95.47 61.42 60.04 ANA Mean Median 60.81 75.82 67.68 96.71 84.47 29.80 40.72 63.54 11.72 57.01 15.63 42.95 45.49 19.68 16.02 98.00 96.72 32.37 13.50 107.03 31.03 52.06 29.85 104.93 101.69 62.24 44.79 44.47 48.95 79 E 73.44 30.91 36.23 38.34 97.60 90.18 20.87 43.83 18.96 55.92 65.52 52.18 86.11 107.04 86.23 12.14 13.09 107.34 47.82 93.30 16.48 24.23 89.27 49.32 109.84 98.40 24.00 108.48 91.01 4 9 11 4255 7692 72 70 30M 72 26.59 5 256 S3 -- 15... 4) Assume the date represents lengths of Molokheyya rods in CM, and those rods spreading more than 70 CM will sell better. a. Describe the performance of these 100 rods in sales. b. Dissect the rod into lengths groups, with each group is between 10s, then assume that any rod less than 20 cm will not cell while prices of each rod above that equals to length X 0.0011 JD. Describe the sales of the farmer who got these 100 rods out of one squared meter in his farm, knowing that he planted 7 Donoms. In part b, which group has the highest sales? Which has the lowest? Make a table of sales of all groups c. 79.35 51.56 45.47 20.88 33.68 70.18 92.65 45.99 61.96 90.35 98.18 31.11 46.75 38.95 80.43 82.37 105.90 101.35 60.81 69.10 51.32 104.81 67.94 85.52 62.63 54.11 95.47 61.42 60.04 ANA Mean Median 60.81 75.82 67.68 96.71 84.47 29.80 40.72 63.54 11.72 57.01 15.63 42.95 45.49 19.68 16.02 98.00 96.72 32.37 13.50 107.03 31.03 52.06 29.85 104.93 101.69 62.24 44.79 44.47 48.95 79 E 73.44 30.91 36.23 38.34 97.60 90.18 20.87 43.83 18.96 55.92 65.52 52.18 86.11 107.04 86.23 12.14 13.09 107.34 47.82 93.30 16.48 24.23 89.27 49.32 109.84 98.40 24.00 108.48 91.01 4 9 11 4255 7692 72 70 30M 72 26.59 5 256 S3 -- 15


