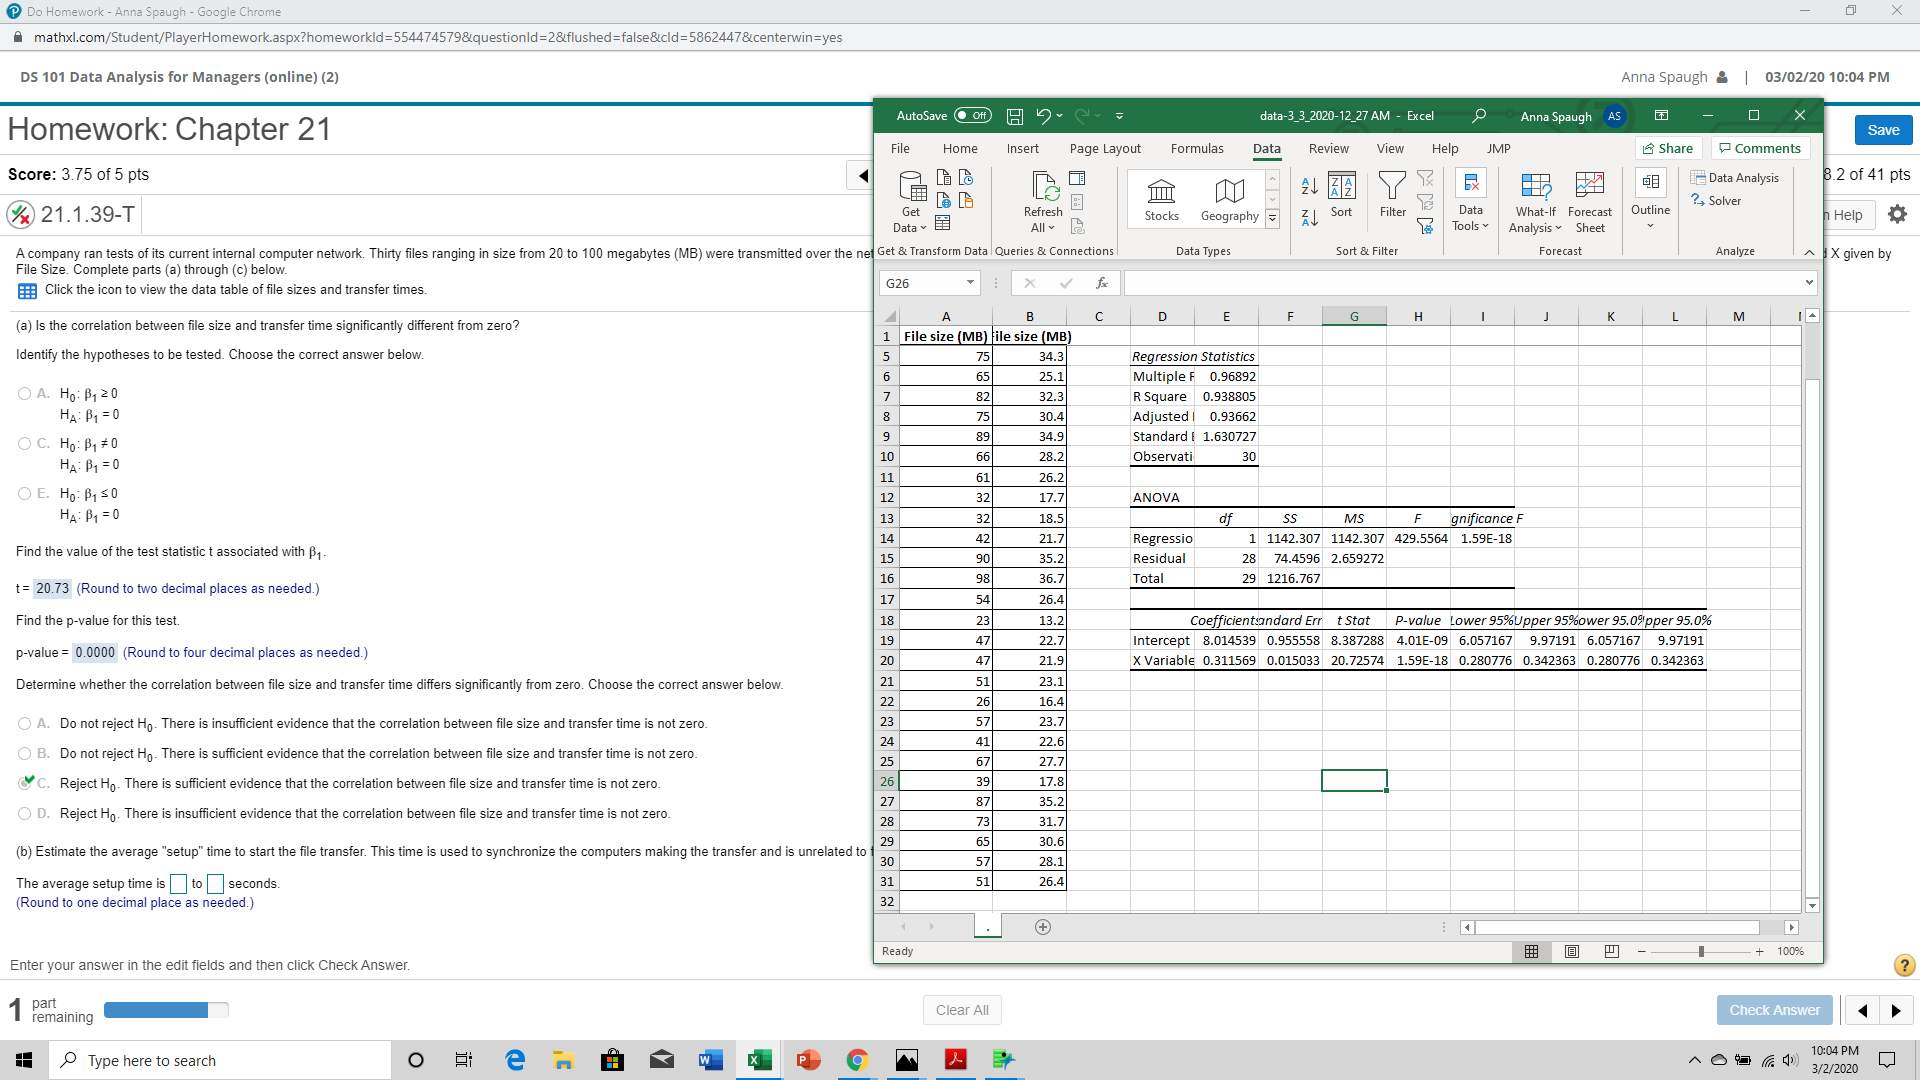
I need help with part b and part c. I provided a picture below that shows the problem and has the data table in the excel sheet.
A company ran tests of its current internal computer network. Thirty files ranging in size from 20 to 100 megabytes?(MB) were transmitted over the network at various times of?day, and the time to send the files?recorded, as shown in the accompanying data table. Formulate the SRM with Y given by Transfer Time and X given by File Size. Complete parts?(a) through?(c) below
Click the icon to view the data table of file sizes and transfer times.
?(b) Estimate the average?"setup" time to start the file transfer. This time is used to synchronize the computers making the transfer and is unrelated to file size. Use a confidence level of?95%.
The average setup time is to seconds.
?( Round to one decimal place as?needed.)
Part c comes up after part b.
Do Homework - Anna Spaugh - Google Chrome mathxl.com/Student/PlayerHomework.aspx?homeworkld=554474579&questionld=2&flushed=false&cld=5862447¢erwin=yes DS 101 Data Analysis for Managers (online) (2) Anna Spaugh & | 03/02/20 10:04 PM Homework: Chapter 21 AutoSave (C of) H - data-3_3_2020-12_27 AM - Excel LO Anna Spaugh AS O X Save File Home Insert Page Layout Formulas Data Review View Help JMP Share Comments Score: 3.75 of 5 pts 24 2 2 Data Analysis 8.2 of 41 pts x 21.1.39-T Get Refresh Stocks Geography Z | Sort Filter Data Outline ?, Solver Data All Tools v What-If Forecast Analysis Sheet Help A company ran tests of its current internal computer network. Thirty files ranging in size from 20 to 100 megabytes (MB) were transmitted over the net Get & Transform Data | Queries & Connections Data Types Sort & Filter Forecast Analyze X given by File Size. Complete parts (a) through (c) below. Click the icon to view the data table of file sizes and transfer times G26 X V (a) Is the correlation between file size and transfer time significantly different from zero? A B F G H K M File size (MB) file size (MB) Identify the hypotheses to be tested. Choose the correct answer below. 34.3 Regression Statistics Multiple F 0.96892 OA. Ho: B1 20 25.1 32.3 R Square 0.938805 HA: B1 = 0 30.4 Adjusted| 0.93662 OC. Ho: B1 0 34.9 Standard [ 1.630727 HA : B1 = 0 28.2 Observat 30 OE. HO: B, SO 26.2 HA: B1 = 0 17.7 ANOVA 18.5 df SS MS F gnificance F Find the value of the test statistic t associated with B1. 21.7 Regressio 1 1142.307 1142.307 429.5564 1.59E-18 35.2 Residual 28 74.4596 2.659272 1= 20.73 (Round to two decimal places as needed.) 36.7 Tota 29 1216.767 26.4 Find the p-value for this test. 13.2 Coefficientsandard Err t Stat P-value Lower 95%Upper 95%ower 95.09pper 95.0% p-value = 0.0000 (Round to four decimal places as needed.) 22.7 Intercept 8.014539 0.955558 8.387288 4.01E-09 6.057167 9.97191 6.057167 9.97191 X Variable 0.311569 0.015033 20.72574 1.59E-18 0.280776 0.342363 0.280776 0.342363 Determine whether the correlation between file size and transfer time differs significantly from zero. Choose the correct answer below. O A. Do not reject Ho. There is insufficient evidence that the correlation between file size and transfer time is not zero. O B. Do not reject Ho. There is sufficient evidence that the correlation between file size and transfer time is not zero. C. Reject Ho- There is sufficient evidence that the correlation between file size and transfer time is not zero 17.8 O D. Reject Ho. There is insufficient evidence that the correlation between file size and transfer time is not zero. 35.2 31.7 (b) Estimate the average "setup" time to start the file transfer. This time is used to synchronize the computers making the transfer and is unrelated to 30 .6 28.1 The average setup time is to seconds. 26.4 Round to one decimal place as needed.) 32 + Ready Enter your answer in the edit fields and then click Check Answer. O J -- + 100% part remaining Clear All Check Answer Type here to search O P 10:04 PM 3/2/2020


