I need help with providing the following in comparing Academy Sports & Outdoors to Dick's Sporting Goods
1. Company Overview and Highlights
2. Financial Analysis
3. Conclusions
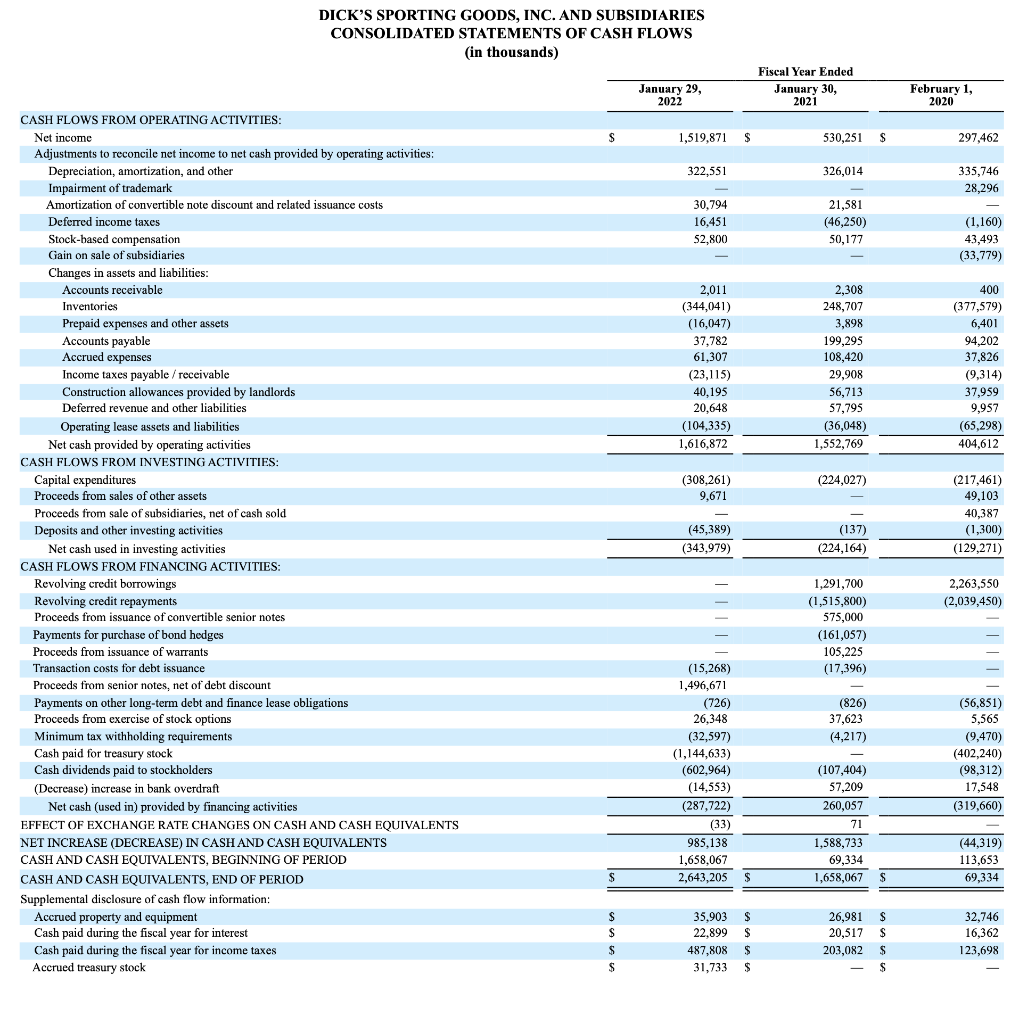
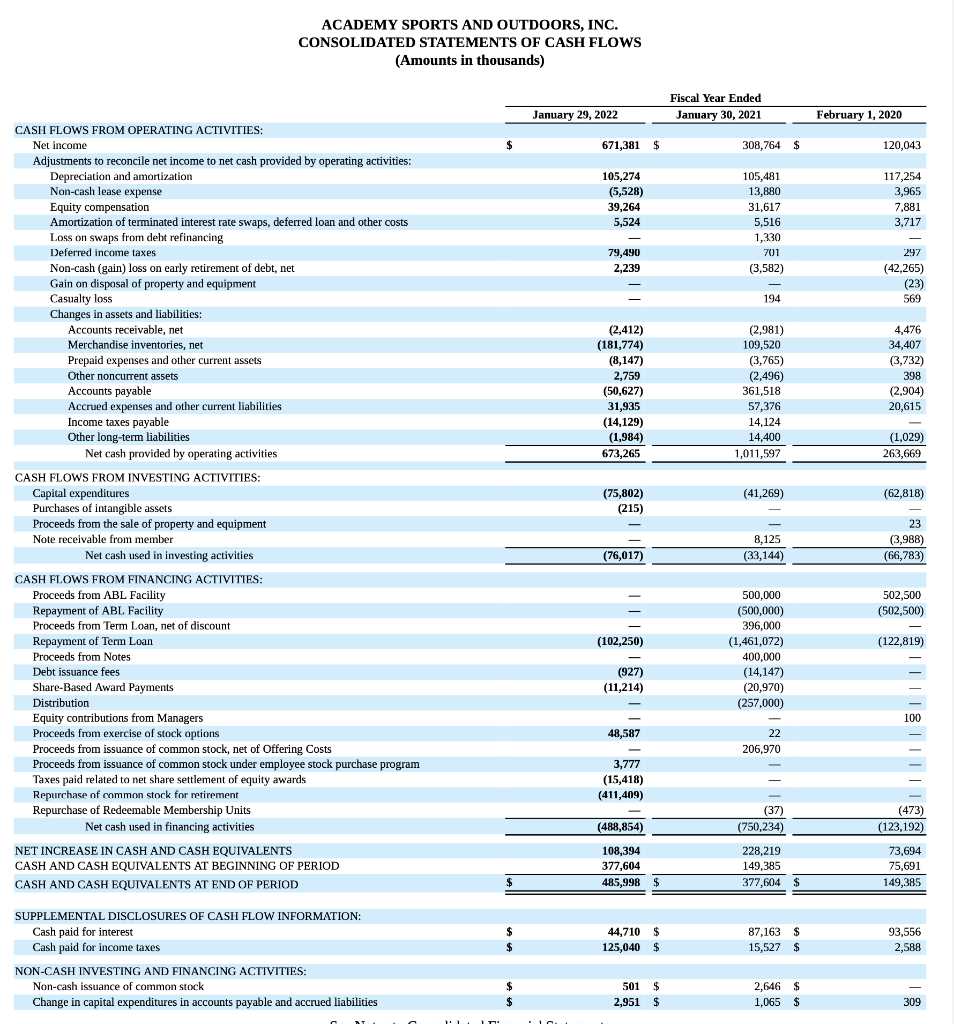
DICK'S SPORTING GOODS, INC. AND SUBSIDIARIES CONSOLIDATED STATEMENTS OF CASH FLOWS (in thousands) January 29, 2022 $ CASH FLOWS FROM OPERATING ACTIVITIES: Net income Adjustments to reconcile net income to net cash provided by operating activities: Depreciation, amortization, and other Impairment of trademark Amortization of convertible note discount and related issuance costs Deferred income taxes Stock-based compensation Gain on sale of subsidiaries Changes in assets and liabilities: Accounts receivable Inventories Prepaid expenses and other assets Accounts payable Accrued expenses Income taxes payable/receivable Construction allowances provided by landlords Deferred revenue and other liabilities Operating lease assets and liabilities Net cash provided by operating activities CASH FLOWS FROM INVESTING ACTIVITIES: Capital expenditures Proceeds from sales of other assets Proceeds from sale of subsidiaries, net of cash sold Deposits and other investing activities Net cash used in investing activities CASH FLOWS FROM FINANCING ACTIVITIES: Revolving credit borrowings Revolving credit repayments Proceeds from issuance of convertible senior notes Payments for purchase of bond hedges Proceeds from issuance of warrants Transaction costs for debt issuance Proceeds from senior notes, net of debt discount Payments on other long-term debt and finance lease obligations Proceeds from exercise of stock options Minimum tax withholding requirements Cash paid for treasury stock Cash dividends paid to stockholders (Decrease) increase in bank overdraft Net cash (used in) provided by financing activities EFFECT OF EXCHANGE RATE CHANGES ON CASH AND CASH EQUIVALENTS NET INCREASE (DECREASE) IN CASH AND CASH EQUIVALENTS CASH AND CASH EQUIVALENTS, BEGINNING OF PERIOD CASH AND CASH EQUIVALENTS, END OF PERIOD Supplemental disclosure of cash flow information: Accrued property and equipment Cash paid during the fiscal year for interest Cash paid during the fiscal year for income taxes Accrued treasury stock $ S $ S $ 1,519,871 322,551 30,794 16,451 $2,800 2,011 (344,041) (16,047) 37,782 61,307 (23,115) 40,195 20,648 (104,335) 1,616,872 (308,261) 9,671 (45,389) (343,979) ||||| $ (15,268) 1,496,671 (726) 26,348 (32,597) (1,144,633) (602,964) (14,553) (287,722) (33) 985,138 1,658,067 2,643,205 $ 35,903 $ 22,899 $ 487,808 $ 31,733 $ Fiscal Year Ended January 30, 2021 530,251 $ 326,014 21,581 (46,250) 50,177 2,308 248,707 3,898 199,295 108,420 29,908 56,713 57,795 (36,048) 1,552,769 (224,027) (137) (224,164) 1,291,700 (1,515,800) 575,000 (161,057) 105,225 (17,396) - (826) 37,623 (4,217) (107,404) 57,209 260,057 71 1,588,733 69,334 1,658,067 $ 26,981 $ 20,517 S 203,082 $ $ February 1, 2020 297,462 335,746 28,296 (1,160) 43,493 (33,779) 400 (377,579) 6,401 94,202 37,826 (9,314) 37,959 9,957 (65,298) 404,612 (217,461) 49,103 40,387 (1,300) (129,271) 2,263,550 (2,039,450) (56,851) 5,565 (9,470) (402,240) (98,312) 17,548 (319,660) (44,319) 113,653 69,334 32,746 16,362 123,698 ACADEMY SPORTS AND OUTDOORS, INC. CONSOLIDATED STATEMENTS OF CASH FLOWS (Amounts in thousands) January 29, 2022 CASH FLOWS FROM OPERATING ACTIVITIES: Net income Adjustments to reconcile net income to net cash provided by operating activities: Depreciation and amortization Non-cash lease expense Equity compensation Amortization of terminated interest rate swaps, deferred loan and other costs Loss on swaps from debt refinancing Deferred income taxes Non-cash (gain) loss on early retirement of debt, net Gain on disposal of property and equipment Casualty loss. Changes in assets and liabilities: Accounts receivable, net Merchandise inventories, net Prepaid expenses and other current assets Other noncurrent assets Accounts payable Accrued expenses and other current liabilities Income taxes payable Other long-term liabilities Net cash provided by operating activities CASH FLOWS FROM INVESTING ACTIVITIES: Capital expenditures Purchases of intangible assets Proceeds from the sale of property and equipment Note receivable from member Net cash used in investing activities CASH FLOWS FROM FINANCING ACTIVITIES: Proceeds from ABL Facility Repayment of ABL Facility Proceeds from Term Loan, net of discount Repayment of Term Loan Proceeds from Notes Debt issuance fees Share-Based Award Payments Distribution Equity contributions from Managers Proceeds from exercise of stock options Proceeds from issuance of common stock, net of Offering Costs Proceeds from issuance of common stock under employee stock purchase program Taxes paid related to net share settlement of equity awards Repurchase of common stock for retirement Repurchase of Redeemable Membership Units Net cash used in financing activities NET INCREASE IN CASH AND CASH EQUIVALENTS CASH AND CASH EQUIVALENTS AT BEGINNING OF PERIOD CASH AND CASH EQUIVALENTS AT END OF PERIOD SUPPLEMENTAL DISCLOSURES OF CASH FLOW INFORMATION: Cash paid for interest Cash paid for income taxes NON-CASH INVESTING AND FINANCING ACTIVITIES: Non-cash issuance of common stock Change in capital expenditures in accounts payable and accrued liabilities PITT $ $ $ $ $ 671,381 105,274 (5,528) 39,264 5,524 79,490 2,239 (2,412) (181,774) (8,147) 2,759 (50,627) 31,935 (14,129) (1,984) 673,265 (75,802) (215) (76,017) (102,250) (927) (11,214) - 48,587 3,777 (15,418) (411,409) (488,854) 108,394 377,604 485,998 $ 44,710 $ 125,040 $ 501 $ 2,951 $ Fiscal Year Ended January 30, 2021 308,764 $ 105,481 13,880 31,617 5,516 1,330 701 (3,582) 194 (2,981) 109,520 (3,765) (2,496) 361,518 57,376 14,124 14,400 1,011,597 (41,269) 8,125 (33,144) 500,000 (500,000) 396,000 (1,461,072) 400,000 (14,147) (20,970) (257,000) 22 206,970 (37) (750,234) 228.219 149,385 377,604 $ 87,163 $ 15,527 $ 2,646 $ 1,065 $ February 1, 2020 120,043 117,254 3,965 7,881 3,717 297 (42,265) (23) 569 4,476 34,407 (3,732) 398 (2,904) 20,615 (1,029) 263,669 (62,818) - 23 (3,988) (66,783) 502,500 (502,500) (122,819) 100 (473) (123,192) 73,694 75,691 149,385 93,556 2,588 309 DICK'S SPORTING GOODS, INC. AND SUBSIDIARIES CONSOLIDATED STATEMENTS OF CASH FLOWS (in thousands) January 29, 2022 $ CASH FLOWS FROM OPERATING ACTIVITIES: Net income Adjustments to reconcile net income to net cash provided by operating activities: Depreciation, amortization, and other Impairment of trademark Amortization of convertible note discount and related issuance costs Deferred income taxes Stock-based compensation Gain on sale of subsidiaries Changes in assets and liabilities: Accounts receivable Inventories Prepaid expenses and other assets Accounts payable Accrued expenses Income taxes payable/receivable Construction allowances provided by landlords Deferred revenue and other liabilities Operating lease assets and liabilities Net cash provided by operating activities CASH FLOWS FROM INVESTING ACTIVITIES: Capital expenditures Proceeds from sales of other assets Proceeds from sale of subsidiaries, net of cash sold Deposits and other investing activities Net cash used in investing activities CASH FLOWS FROM FINANCING ACTIVITIES: Revolving credit borrowings Revolving credit repayments Proceeds from issuance of convertible senior notes Payments for purchase of bond hedges Proceeds from issuance of warrants Transaction costs for debt issuance Proceeds from senior notes, net of debt discount Payments on other long-term debt and finance lease obligations Proceeds from exercise of stock options Minimum tax withholding requirements Cash paid for treasury stock Cash dividends paid to stockholders (Decrease) increase in bank overdraft Net cash (used in) provided by financing activities EFFECT OF EXCHANGE RATE CHANGES ON CASH AND CASH EQUIVALENTS NET INCREASE (DECREASE) IN CASH AND CASH EQUIVALENTS CASH AND CASH EQUIVALENTS, BEGINNING OF PERIOD CASH AND CASH EQUIVALENTS, END OF PERIOD Supplemental disclosure of cash flow information: Accrued property and equipment Cash paid during the fiscal year for interest Cash paid during the fiscal year for income taxes Accrued treasury stock $ S $ S $ 1,519,871 322,551 30,794 16,451 $2,800 2,011 (344,041) (16,047) 37,782 61,307 (23,115) 40,195 20,648 (104,335) 1,616,872 (308,261) 9,671 (45,389) (343,979) ||||| $ (15,268) 1,496,671 (726) 26,348 (32,597) (1,144,633) (602,964) (14,553) (287,722) (33) 985,138 1,658,067 2,643,205 $ 35,903 $ 22,899 $ 487,808 $ 31,733 $ Fiscal Year Ended January 30, 2021 530,251 $ 326,014 21,581 (46,250) 50,177 2,308 248,707 3,898 199,295 108,420 29,908 56,713 57,795 (36,048) 1,552,769 (224,027) (137) (224,164) 1,291,700 (1,515,800) 575,000 (161,057) 105,225 (17,396) - (826) 37,623 (4,217) (107,404) 57,209 260,057 71 1,588,733 69,334 1,658,067 $ 26,981 $ 20,517 S 203,082 $ $ February 1, 2020 297,462 335,746 28,296 (1,160) 43,493 (33,779) 400 (377,579) 6,401 94,202 37,826 (9,314) 37,959 9,957 (65,298) 404,612 (217,461) 49,103 40,387 (1,300) (129,271) 2,263,550 (2,039,450) (56,851) 5,565 (9,470) (402,240) (98,312) 17,548 (319,660) (44,319) 113,653 69,334 32,746 16,362 123,698 ACADEMY SPORTS AND OUTDOORS, INC. CONSOLIDATED STATEMENTS OF CASH FLOWS (Amounts in thousands) January 29, 2022 CASH FLOWS FROM OPERATING ACTIVITIES: Net income Adjustments to reconcile net income to net cash provided by operating activities: Depreciation and amortization Non-cash lease expense Equity compensation Amortization of terminated interest rate swaps, deferred loan and other costs Loss on swaps from debt refinancing Deferred income taxes Non-cash (gain) loss on early retirement of debt, net Gain on disposal of property and equipment Casualty loss. Changes in assets and liabilities: Accounts receivable, net Merchandise inventories, net Prepaid expenses and other current assets Other noncurrent assets Accounts payable Accrued expenses and other current liabilities Income taxes payable Other long-term liabilities Net cash provided by operating activities CASH FLOWS FROM INVESTING ACTIVITIES: Capital expenditures Purchases of intangible assets Proceeds from the sale of property and equipment Note receivable from member Net cash used in investing activities CASH FLOWS FROM FINANCING ACTIVITIES: Proceeds from ABL Facility Repayment of ABL Facility Proceeds from Term Loan, net of discount Repayment of Term Loan Proceeds from Notes Debt issuance fees Share-Based Award Payments Distribution Equity contributions from Managers Proceeds from exercise of stock options Proceeds from issuance of common stock, net of Offering Costs Proceeds from issuance of common stock under employee stock purchase program Taxes paid related to net share settlement of equity awards Repurchase of common stock for retirement Repurchase of Redeemable Membership Units Net cash used in financing activities NET INCREASE IN CASH AND CASH EQUIVALENTS CASH AND CASH EQUIVALENTS AT BEGINNING OF PERIOD CASH AND CASH EQUIVALENTS AT END OF PERIOD SUPPLEMENTAL DISCLOSURES OF CASH FLOW INFORMATION: Cash paid for interest Cash paid for income taxes NON-CASH INVESTING AND FINANCING ACTIVITIES: Non-cash issuance of common stock Change in capital expenditures in accounts payable and accrued liabilities PITT $ $ $ $ $ 671,381 105,274 (5,528) 39,264 5,524 79,490 2,239 (2,412) (181,774) (8,147) 2,759 (50,627) 31,935 (14,129) (1,984) 673,265 (75,802) (215) (76,017) (102,250) (927) (11,214) - 48,587 3,777 (15,418) (411,409) (488,854) 108,394 377,604 485,998 $ 44,710 $ 125,040 $ 501 $ 2,951 $ Fiscal Year Ended January 30, 2021 308,764 $ 105,481 13,880 31,617 5,516 1,330 701 (3,582) 194 (2,981) 109,520 (3,765) (2,496) 361,518 57,376 14,124 14,400 1,011,597 (41,269) 8,125 (33,144) 500,000 (500,000) 396,000 (1,461,072) 400,000 (14,147) (20,970) (257,000) 22 206,970 (37) (750,234) 228.219 149,385 377,604 $ 87,163 $ 15,527 $ 2,646 $ 1,065 $ February 1, 2020 120,043 117,254 3,965 7,881 3,717 297 (42,265) (23) 569 4,476 34,407 (3,732) 398 (2,904) 20,615 (1,029) 263,669 (62,818) - 23 (3,988) (66,783) 502,500 (502,500) (122,819) 100 (473) (123,192) 73,694 75,691 149,385 93,556 2,588 309