Answered step by step
Verified Expert Solution
Question
1 Approved Answer
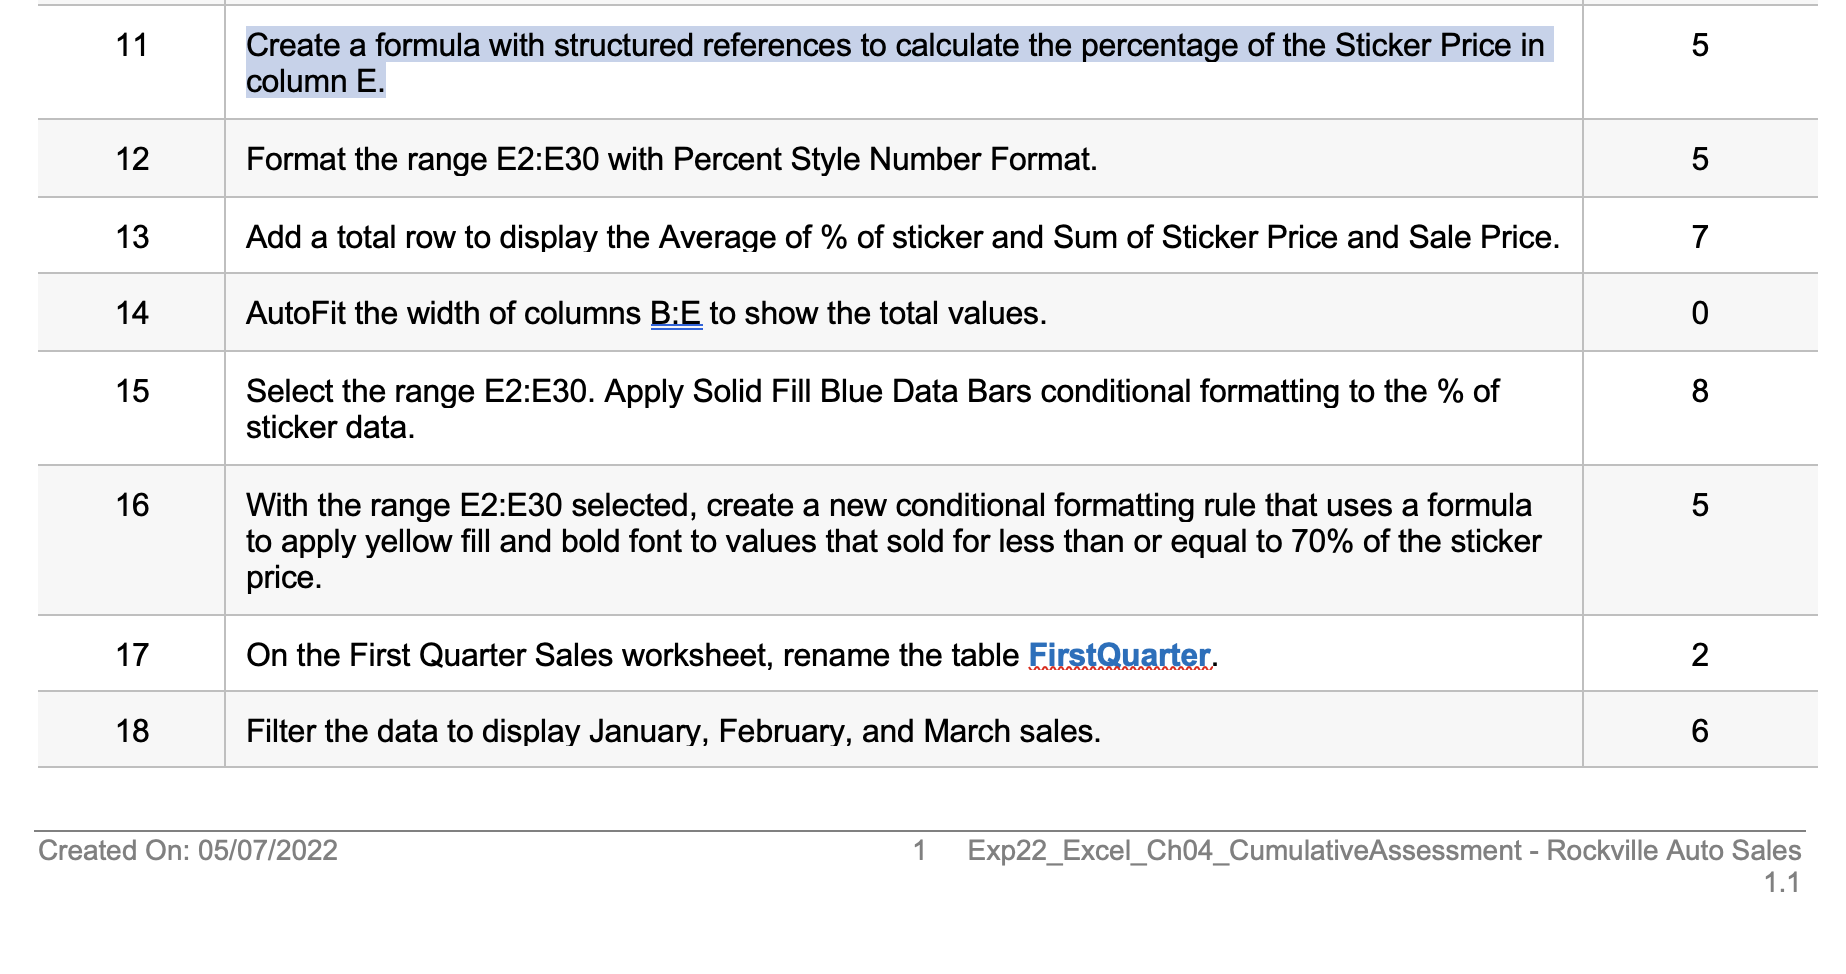
I need help with question 11, if you want to answer more of the question that would be awesome too! begin{tabular}{c|l|l|} hline 11 & Create


I need help with question 11, if you want to answer more of the question that would be awesome too!
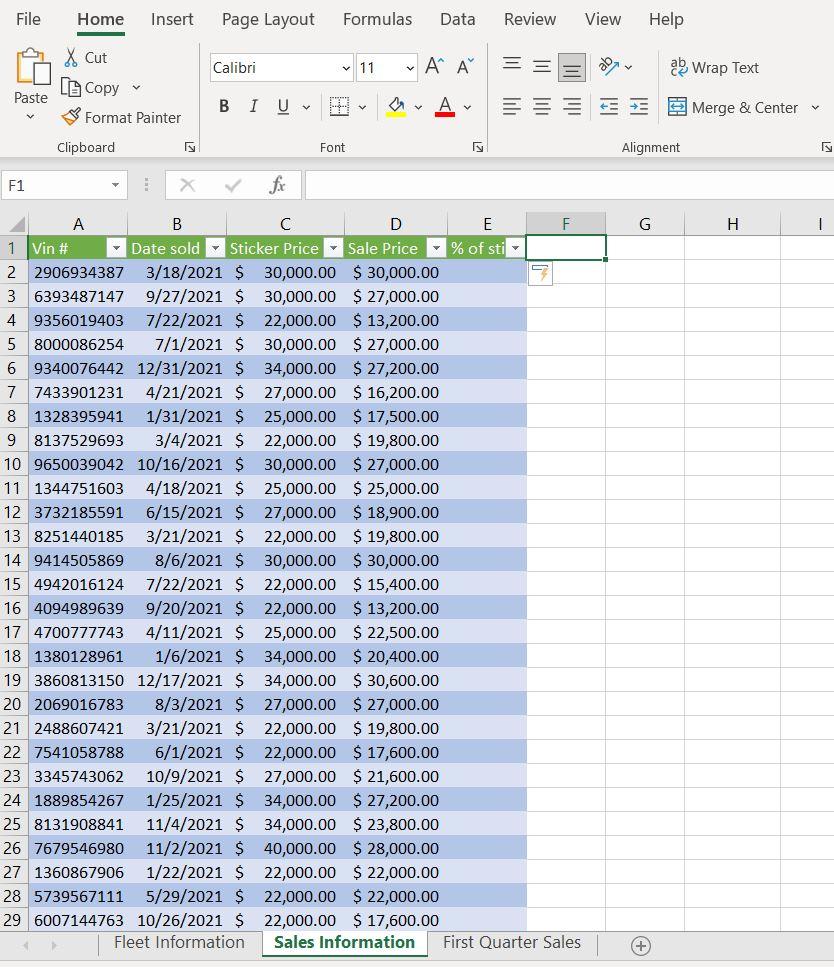
\begin{tabular}{c|l|l|} \hline 11 & Create a formula with structured references to calculate the percentage of the Sticker Price in column E. \\ \hline 12 & Format the range E2:E30 with Percent Style Number Format. \\ \hline 13 & Add a total row to display the Average of \% of sticker and Sum of Sticker Price and Sale Price. & 5 \\ \hline 14 & AutoFit the width of columns B:E to show the total values. \\ \hline 15 & Select the range E2:E30. Apply Solid Fill Blue Data Bars conditional formatting to the \% of sticker data. & 5 \\ \hline 16 & With the range E2:E30 selected, create a new conditional formatting rule that uses a formula to apply yellow fill and bold font to values that sold for less than or equal to 70% of the sticker price. \\ \hline 17 & On the First Quarter Sales worksheet, rename the table FirstQuarter. \\ \hline 18 & Filter the data to display January, February, and March sales. \\ \hline \end{tabular} Created On: 05/07/2022 1 Exp22_Excel_Ch04_CumulativeAssessment - Rockville Auto Sales File Home Insert Page Layout Formulas Data Review View HelpStep by Step Solution
There are 3 Steps involved in it
Step: 1

Get Instant Access to Expert-Tailored Solutions
See step-by-step solutions with expert insights and AI powered tools for academic success
Step: 2

Step: 3

Ace Your Homework with AI
Get the answers you need in no time with our AI-driven, step-by-step assistance
Get Started


