Answered step by step
Verified Expert Solution
Question
1 Approved Answer
I need help with question 2. Type measurements and observations recorded in your laboratory notebook neatly into the data table below. Add a title to
I need help with question 2. 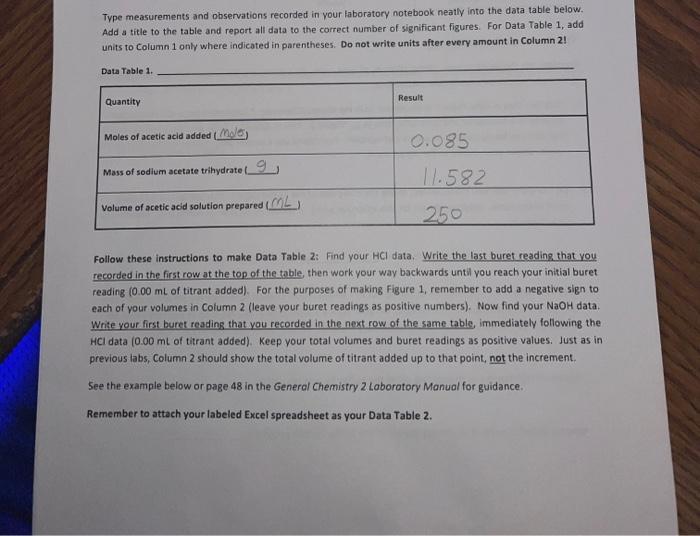
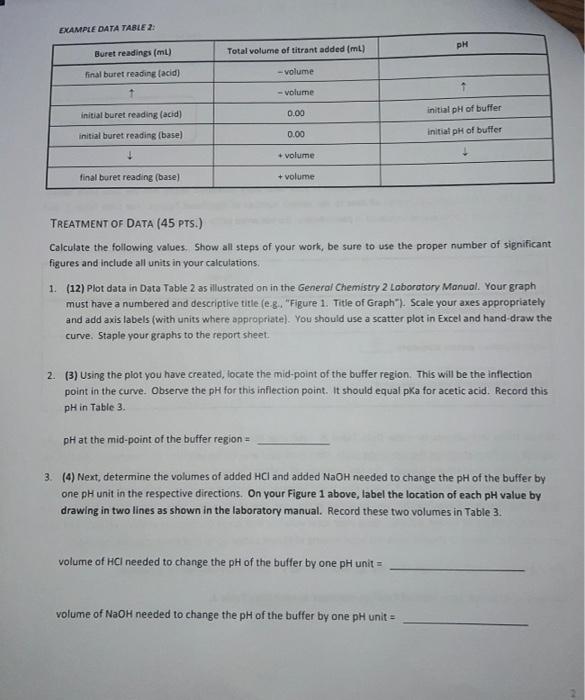
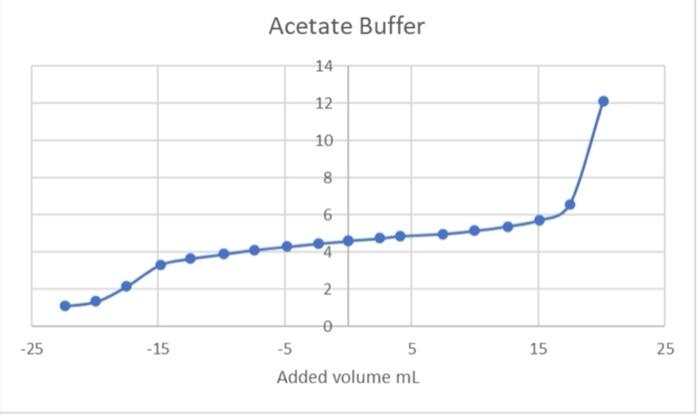
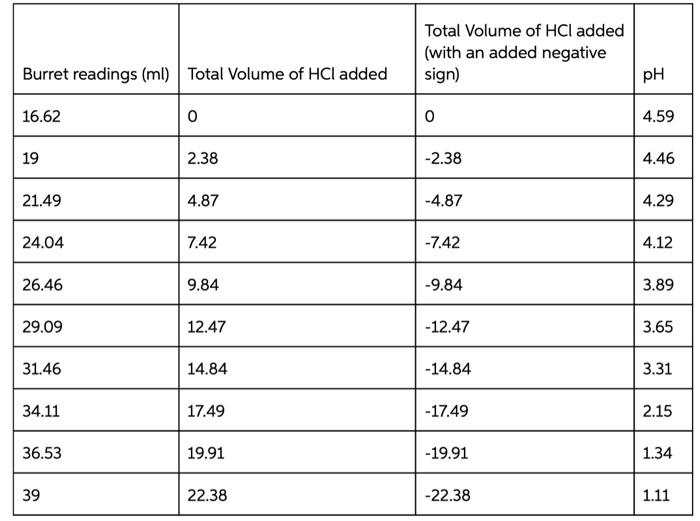
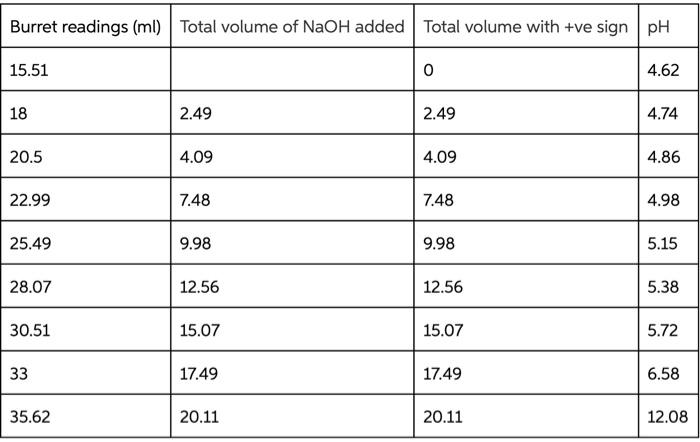
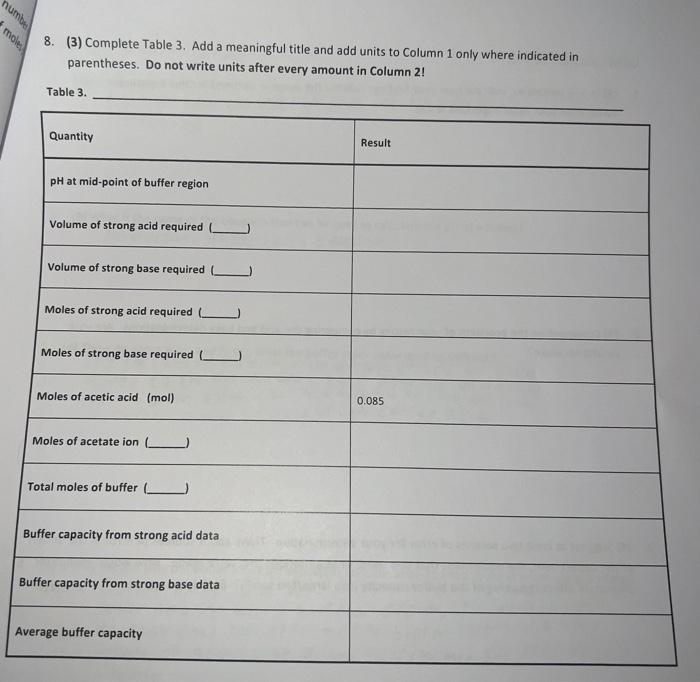
Type measurements and observations recorded in your laboratory notebook neatly into the data table below. Add a title to the table and report all data to the correct number of significant figures For Data Table 1, add units to Column 1 only where indicated in parentheses. Do not write units after every amount in Column 2! Data Table 1. Quantity Result Moles of acetic acid added mod 0.085 Mass of sodium acetate trilhydrate 9 11.582 Volume of acetic acid solution prepared 250 Follow these instructions to make Data Table 2: Find your HCl data. Write the last buret reading that you recorded in the first row at the top of the table, then work your way backwards until you reach your initial buret reading (0.00 mL of titrant added). For the purposes of making Figure 1. remember to add a negative sign to each of your volumes in Column 2 (leave your buret readings as positive numbers). Now find your NaOH data Write your first buret reading that you recorded in the next row of the same table, immediately following the HCl data (0.00 mL of titrant added). Keep your total volumes and buret readings as positive values. Just as in previous tabs, Column 2 should show the total volume of titrant added up to that point, not the increment. See the example below or page 48 in the General Chemistry 2 Laboratory Manual for guidance. Remember to attach your labeled Excel spreadsheet as your Data Table 2. EXAMPLE DATA TABLE 2: pH Buret readings (ml) Total volume of titrant added (ml) final buret reading (acid) - volume - volume initial buret reading (acid) 0.00 initial pH of buffer initial buret reading (base) 0.00 initial pH of butter + volume final buret reading (base) + volume TREATMENT OF DATA (45 PTS.) Calculate the following values. Show all steps of your work, be sure to use the proper number of significant figures and include all units in your calculations. 1. (12) Plot data in Data Table 2 as illustrated on in the General Chemistry 2 Laboratory Manual. Your graph must have a numbered and descriptive title (es. "Figure 1. Title of Graph"). Scale your axes appropriately and add axis labels (with units where appropriate). You should use a scatter plot in Excel and hand draw the curve. Staple your graphs to the report sheet. 2. (3) Using the plot you have created, locate the mid-point of the buffer region. This will be the inflection point in the curve. Observe the pH for this inflection point. It should equal pKa for acetic acid. Record this pH in Table 3 pH at the mid-point of the buffer region = 3. (4) Next, determine the volumes of added HCl and added NaOH needed to change the pH of the buffer by one pH unit in the respective directions. On your Figure 1 above, label the location of each pH value by drawing in two lines as shown in the laboratory manual. Record these two volumes in Table 3. volume of HCI needed to change the pH of the buffer by one pH unit = volume of NaOH needed to change the pH of the buffer by one pH unit = Acetate Buffer 14 12 10 8 6 . N -25 -15 0 -5 5 Added volume ml 15 25 Total Volume of HCl added (with an added negative sign) Burret readings (ml) Total Volume of HCl added pH 16.62 0 0 4.59 19 2.38 -2.38 4.46 21.49 4.87 -4.87 4.29 24.04 7.42 -7.42 4.12 26.46 9.84 -9.84 3.89 29.09 12.47 -12.47 3.65 31.46 14.84 -14.84 3.31 34.11 17.49 -17.49 2.15 36.53 19.91 -19.91 1.34 39 22.38 -22.38 1.11 Burret readings (ml) Total volume of NaOH added Total volume with +ve sign pH 15.51 0 4.62 18 2.49 2.49 4.74 20.5 4.09 4.09 4.86 22.99 7.48 7.48 4.98 25.49 9.98 9.98 5.15 28.07 12.56 12.56 5.38 30.51 15.07 15.07 5.72 33 17.49 17.49 6.58 35.62 20.11 20.11 12.08 num mole 8. (3) Complete Table 3. Add a meaningful title and add units to Column 1 only where indicated in parentheses. Do not write units after every amount in Column 2! Table 3. Quantity Result pH at mid-point of buffer region Volume of strong acid required Volume of strong base required L Moles of strong acid required Moles of strong base required Moles of acetic acid (mol) 0.085 Moles of acetate ion ) Total moles of buffer Buffer capacity from strong acid data Buffer capacity from strong base data Average buffer capacity 


Step by Step Solution
There are 3 Steps involved in it
Step: 1

Get Instant Access to Expert-Tailored Solutions
See step-by-step solutions with expert insights and AI powered tools for academic success
Step: 2

Step: 3

Ace Your Homework with AI
Get the answers you need in no time with our AI-driven, step-by-step assistance
Get Started


