

Answered step by step
Verified Expert Solution
Question
1 Approved Answer
I need help with question 2,3,5, and 6. (20 points) 1. Each worksheet in the excel file Line Fit Data contains a set of data
I need help with question 2,3,5, and 6.
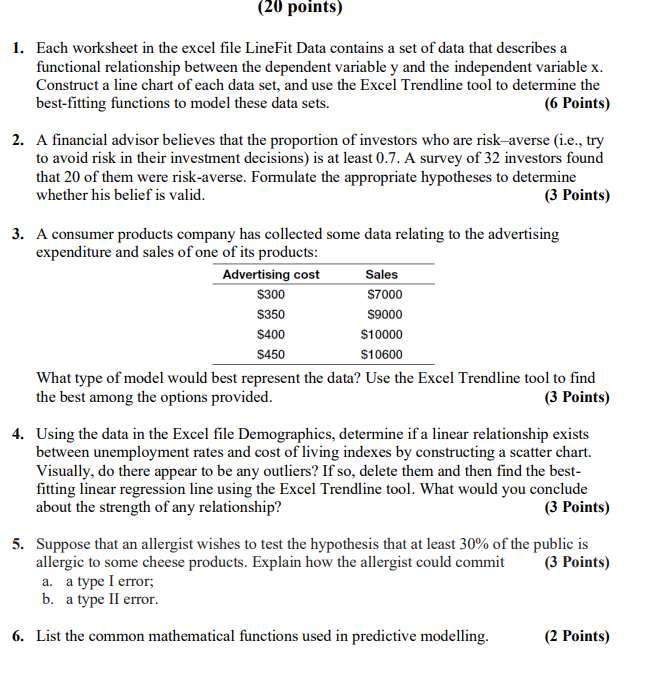
(20 points) 1. Each worksheet in the excel file Line Fit Data contains a set of data that describes a functional relationship between the dependent variable y and the independent variable x. Construct a line chart of each data set, and use the Excel Trendline tool to determine the best-fitting functions to model these data sets. (6 Points) 2. A financial advisor believes that the proportion of investors who are risk-averse (i.e., try to avoid risk in their investment decisions) is at least 0.7. A survey of 32 investors found that 20 of them were risk-averse. Formulate the appropriate hypotheses to determine whether his belief is valid. (3 Points) 3. A consumer products company has collected some data relating to the advertising expenditure and sales of one of its products: Advertising cost Sales $300 $7000 $350 $9000 $400 $10000 $450 $10600 What type of model would best represent the data? Use the Excel Trendline tool to find the best among the options provided. (3 Points) 4. Using the data in the Excel file Demographics, determine if a linear relationship exists between unemployment rates and cost of living indexes by constructing a scatter chart. Visually, do there appear to be any outliers? If so, delete them and then find the best- fitting linear regression line using the Excel Trendline tool. What would you conclude about the strength of any relationship? (3 Points) 5. Suppose that an allergist wishes to test the hypothesis that at least 30% of the public is allergic to some cheese products. Explain how the allergist could commit (3 Points) a. a type I error; b. a type II error. 6. List the common mathematical functions used in predictive modelling. (2 Points) (20 points) 1. Each worksheet in the excel file Line Fit Data contains a set of data that describes a functional relationship between the dependent variable y and the independent variable x. Construct a line chart of each data set, and use the Excel Trendline tool to determine the best-fitting functions to model these data sets. (6 Points) 2. A financial advisor believes that the proportion of investors who are risk-averse (i.e., try to avoid risk in their investment decisions) is at least 0.7. A survey of 32 investors found that 20 of them were risk-averse. Formulate the appropriate hypotheses to determine whether his belief is valid. (3 Points) 3. A consumer products company has collected some data relating to the advertising expenditure and sales of one of its products: Advertising cost Sales $300 $7000 $350 $9000 $400 $10000 $450 $10600 What type of model would best represent the data? Use the Excel Trendline tool to find the best among the options provided. (3 Points) 4. Using the data in the Excel file Demographics, determine if a linear relationship exists between unemployment rates and cost of living indexes by constructing a scatter chart. Visually, do there appear to be any outliers? If so, delete them and then find the best- fitting linear regression line using the Excel Trendline tool. What would you conclude about the strength of any relationship? (3 Points) 5. Suppose that an allergist wishes to test the hypothesis that at least 30% of the public is allergic to some cheese products. Explain how the allergist could commit (3 Points) a. a type I error; b. a type II error. 6. List the common mathematical functions used in predictive modelling. (2 Points)Step by Step Solution
There are 3 Steps involved in it
Step: 1

Get Instant Access to Expert-Tailored Solutions
See step-by-step solutions with expert insights and AI powered tools for academic success
Step: 2

Step: 3
Ace Your Homework with AI
Get the answers you need in no time with our AI-driven, step-by-step assistance
Get Started
Forward Lease Sukuk In Islamic Capital Markets Structure And Governing Rules
Authors: Ahcene Lahsasna , M. Kabir Hassan , Rubi Ahmad
1st Edition
3319942611,331994262X