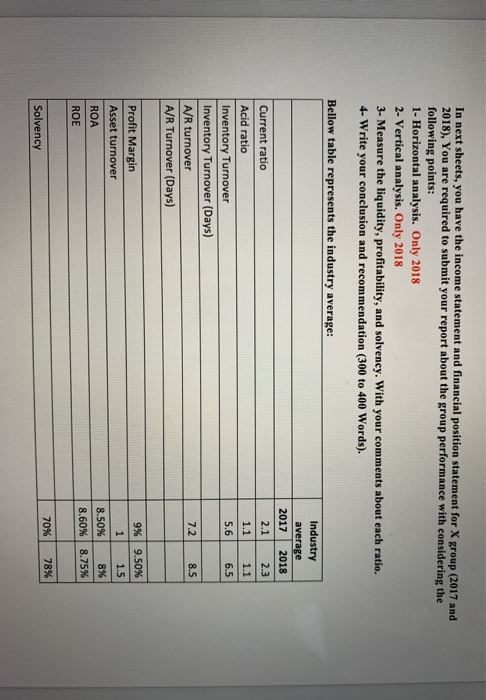
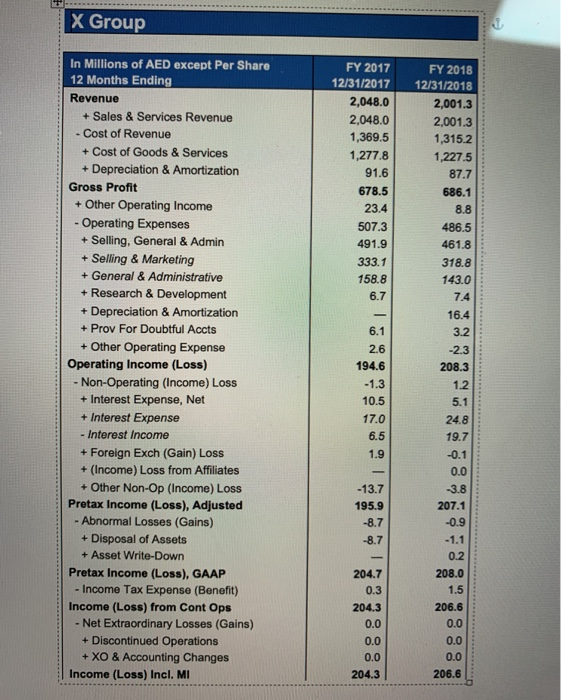
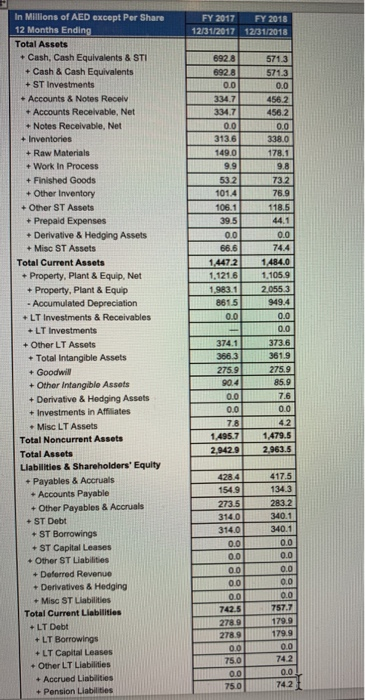
In next sheets, you have the income statement and financial position statement for X group (2017 and 2018), You are required to submit your report about the group performance with considering the following points: 1 - Horizontal analysis. Only 2018 2- Vertical analysis. Only 2018 3- Measure the liquidity, profitability, and solvency. With your comments about each ratio. 4-Write your conclusion and recommendation (300 to 400 Words). Bellow table represents the industry average: Industry average 2017 2018 2.1 2.3 1.1 1.1 6.5 5.6 Current ratio Acid ratio Inventory Turnover Inventory Turnover (Days) A/R turnover A/R Turnover (Days) 7.2 8.5 9% 9.50% Profit Margin Asset turnover 1 1.5 8.50% 8% 8.60% 8.75% ROA ROE 70% 78% Solvency X Group FY 2017 12/31/2017 2,048.0 2,048.0 1,369.5 1,277.8 91.6 678.5 23.4 507.3 491.9 333.1 158.8 6.7 In Millions of AED except Per Share 12 Months Ending Revenue + Sales & Services Revenue - Cost of Revenue + Cost of Goods & Services + Depreciation & Amortization Gross Profit + Other Operating Income Operating Expenses + Selling, General & Admin + Selling & Marketing + General & Administrative + Research & Development + Depreciation & Amortization + Prov For Doubtful Accts + Other Operating Expense Operating Income (Loss) Non-Operating (Income) Loss + Interest Expense, Net + Interest Expense - Interest Income + Foreign Exch (Gain) Loss + (Income) Loss from Affiliates + Other Non-Op (Income) Loss Pretax Income (Loss), Adjusted - Abnormal Losses (Gains) + Disposal of Assets + Asset Write-Down Pretax Income (Loss), GAAP - Income Tax Expense (Benefit) Income (Loss) from Cont Ops - Net Extraordinary Losses (Gains) + Discontinued Operations + XO & Accounting Changes Income (Loss) Incl. MI FY 2018 12/31/2018 2,001.3 2,001.3 1,315.2 1,227.5 87.7 686.1 8.8 486.5 461.8 318.8 143.0 7.4 16.4 3.2 -2.3 208.3 1.2 6.1 2.6 194.6 -1.3 10.5 17.0 6.5 1.9 5.1 -13.7 195.9 -8.7 -8.7 24.8 19.7 -0.1 0.0 -3.8 207.1 -0.9 -1.1 0.2 208.0 1.5 206.6 0.0 -- 204.7 0.3 204.3 0.0 0.0 0.0 204.3 0.0 0.0 206.6 FY 2017 FY 2018 12/31/2017 12/31/2018 6928 692.8 0.0 334.7 334.7 0.0 313.6 149.0 9.9 532 101.4 106.1 39.5 0.0 66.6 1,4472 1.121.6 1.983.1 8615 0.0 In Millions of AED except Per Share 12 Months Ending Total Assets + Cash, Cash Equivalents & STI - Cash & Cash Equivalents + ST Investments + Accounts & Notes Receiv Accounts Receivable, Net +Notes Receivable, Net + Inventories + Raw Materials + Work In Process + Finished Goods + Other Inventory + Other ST Assets + Prepaid Expenses + Derivative & Hedging Assets + Misc ST Assets Total Current Assets + Property, Plant & Equip, Net + Property, Plant & Equip - Accumulated Depreciation +LT Investments & Receivables +LT Investments + Other LT Assets + Total Intangible Assets + Goodwill + Other intangible Assets + Derivative & Hedging Assets + Investments in Affiliates - Misc LT Assets Total Noncurrent Assets Total Assets Liabilities & Shareholders' Equity + Payables & Accruals + Accounts Payable + Other Payables & Accruals + ST Debt + ST Borrowings + ST Capital Leases + Other ST Liabilities + Deferred Revenue + Derivatives & Hedging + Misc ST Liabilities Total Current Liabilities + LT Debt +LT Borrowings + LT Capital Leases + Other LT Liabilities + Accrued Liabilities + Pension Liabilities 5713 571.3 0.0 4562 456.2 0.0 338.0 178.1 9.8 732 76.9 118.5 44.1 0.0 74.4 1.484.0 1,105.9 2,0553 949.4 0.0 0.0 373.6 361.9 275.9 85.9 7.6 0.0 42 1.479.5 2.963.5 374.1 366,3 275.9 90.4 0.0 0.0 7.8 1.495.7 2.942.9 428.4 154.9 273,5 314.0 314.0 0.0 00 00 0.0 0.0 742.5 2789 278.9 0.0 75.0 0.0 750 417.5 134.3 283.2 340.1 340.1 0.0 0.0 0.0 0.0 0.0 757.7 179.9 179.9 0.0 74.2 0.0 742 In next sheets, you have the income statement and financial position statement for X group (2017 and 2018), You are required to submit your report about the group performance with considering the following points: 1 - Horizontal analysis. Only 2018 2- Vertical analysis. Only 2018 3- Measure the liquidity, profitability, and solvency. With your comments about each ratio. 4-Write your conclusion and recommendation (300 to 400 Words). Bellow table represents the industry average: Industry average 2017 2018 2.1 2.3 1.1 1.1 6.5 5.6 Current ratio Acid ratio Inventory Turnover Inventory Turnover (Days) A/R turnover A/R Turnover (Days) 7.2 8.5 9% 9.50% Profit Margin Asset turnover 1 1.5 8.50% 8% 8.60% 8.75% ROA ROE 70% 78% Solvency X Group FY 2017 12/31/2017 2,048.0 2,048.0 1,369.5 1,277.8 91.6 678.5 23.4 507.3 491.9 333.1 158.8 6.7 In Millions of AED except Per Share 12 Months Ending Revenue + Sales & Services Revenue - Cost of Revenue + Cost of Goods & Services + Depreciation & Amortization Gross Profit + Other Operating Income Operating Expenses + Selling, General & Admin + Selling & Marketing + General & Administrative + Research & Development + Depreciation & Amortization + Prov For Doubtful Accts + Other Operating Expense Operating Income (Loss) Non-Operating (Income) Loss + Interest Expense, Net + Interest Expense - Interest Income + Foreign Exch (Gain) Loss + (Income) Loss from Affiliates + Other Non-Op (Income) Loss Pretax Income (Loss), Adjusted - Abnormal Losses (Gains) + Disposal of Assets + Asset Write-Down Pretax Income (Loss), GAAP - Income Tax Expense (Benefit) Income (Loss) from Cont Ops - Net Extraordinary Losses (Gains) + Discontinued Operations + XO & Accounting Changes Income (Loss) Incl. MI FY 2018 12/31/2018 2,001.3 2,001.3 1,315.2 1,227.5 87.7 686.1 8.8 486.5 461.8 318.8 143.0 7.4 16.4 3.2 -2.3 208.3 1.2 6.1 2.6 194.6 -1.3 10.5 17.0 6.5 1.9 5.1 -13.7 195.9 -8.7 -8.7 24.8 19.7 -0.1 0.0 -3.8 207.1 -0.9 -1.1 0.2 208.0 1.5 206.6 0.0 -- 204.7 0.3 204.3 0.0 0.0 0.0 204.3 0.0 0.0 206.6 FY 2017 FY 2018 12/31/2017 12/31/2018 6928 692.8 0.0 334.7 334.7 0.0 313.6 149.0 9.9 532 101.4 106.1 39.5 0.0 66.6 1,4472 1.121.6 1.983.1 8615 0.0 In Millions of AED except Per Share 12 Months Ending Total Assets + Cash, Cash Equivalents & STI - Cash & Cash Equivalents + ST Investments + Accounts & Notes Receiv Accounts Receivable, Net +Notes Receivable, Net + Inventories + Raw Materials + Work In Process + Finished Goods + Other Inventory + Other ST Assets + Prepaid Expenses + Derivative & Hedging Assets + Misc ST Assets Total Current Assets + Property, Plant & Equip, Net + Property, Plant & Equip - Accumulated Depreciation +LT Investments & Receivables +LT Investments + Other LT Assets + Total Intangible Assets + Goodwill + Other intangible Assets + Derivative & Hedging Assets + Investments in Affiliates - Misc LT Assets Total Noncurrent Assets Total Assets Liabilities & Shareholders' Equity + Payables & Accruals + Accounts Payable + Other Payables & Accruals + ST Debt + ST Borrowings + ST Capital Leases + Other ST Liabilities + Deferred Revenue + Derivatives & Hedging + Misc ST Liabilities Total Current Liabilities + LT Debt +LT Borrowings + LT Capital Leases + Other LT Liabilities + Accrued Liabilities + Pension Liabilities 5713 571.3 0.0 4562 456.2 0.0 338.0 178.1 9.8 732 76.9 118.5 44.1 0.0 74.4 1.484.0 1,105.9 2,0553 949.4 0.0 0.0 373.6 361.9 275.9 85.9 7.6 0.0 42 1.479.5 2.963.5 374.1 366,3 275.9 90.4 0.0 0.0 7.8 1.495.7 2.942.9 428.4 154.9 273,5 314.0 314.0 0.0 00 00 0.0 0.0 742.5 2789 278.9 0.0 75.0 0.0 750 417.5 134.3 283.2 340.1 340.1 0.0 0.0 0.0 0.0 0.0 757.7 179.9 179.9 0.0 74.2 0.0 742