I need help with question 3-5
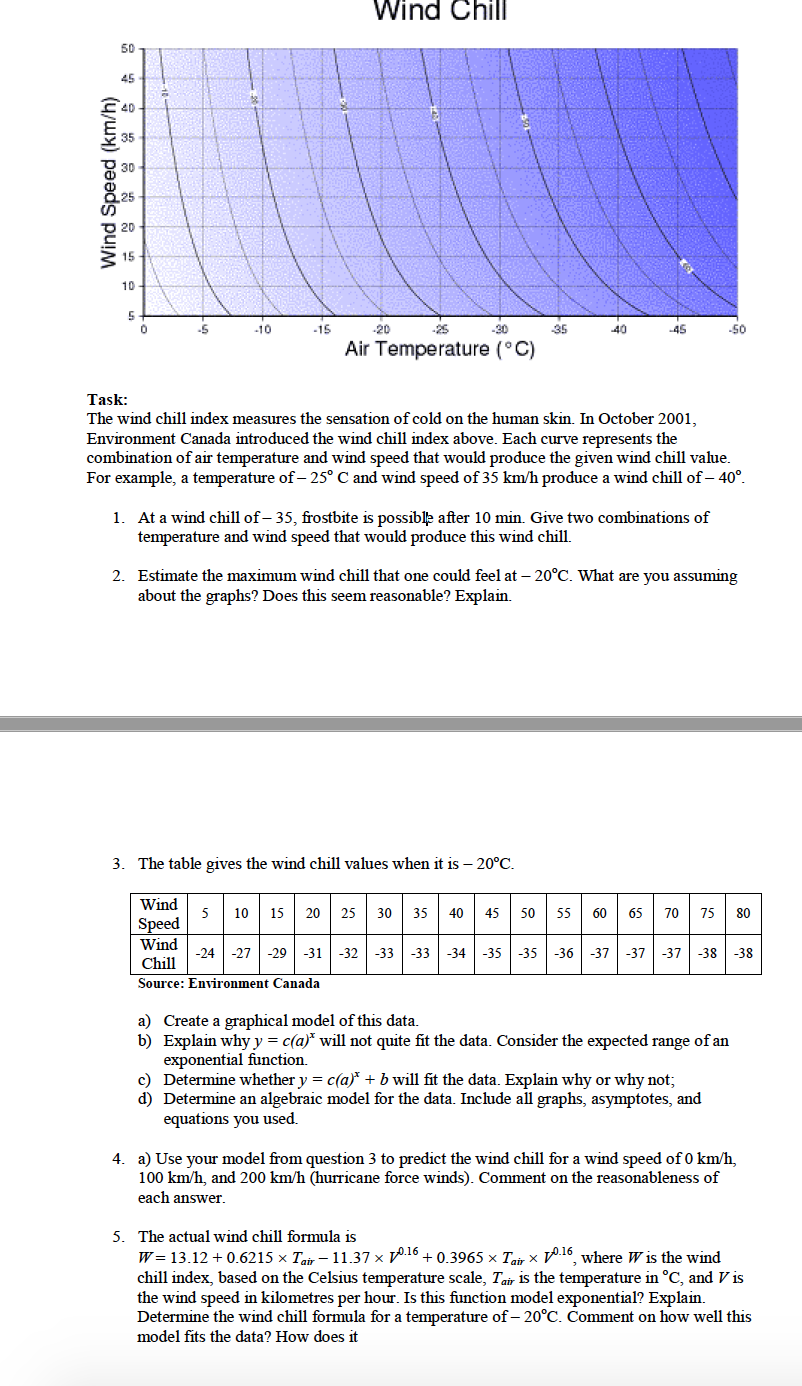
Wind Chill 50 45 Wind Speed (km/h) 35 10 -10 -15 -20 -25 -30 -35 40 -45 -50 Air Temperature (*C) Task: The wind chill index measures the sensation of cold on the human skin. In October 2001, Environment Canada introduced the wind chill index above. Each curve represents the combination of air temperature and wind speed that would produce the given wind chill value. For example, a temperature of - 250 C and wind speed of 35 km/h produce a wind chill of - 40. 1. At a wind chill of - 35, frostbite is possible after 10 min. Give two combinations of temperature and wind speed that would produce this wind chill. 2. Estimate the maximum wind chill that one could feel at - 20"C. What are you assuming about the graphs? Does this seem reasonable? Explain. 3. The table gives the wind chill values when it is - 20"C. Wind 10 15 Speed 20 25 30 35 45 50 60 65 70 75 80 Wind Chill -24 -27 -31 -32 -33 -33 -34 -35 -35 36 -37 37 -37 -38 -38 Source: Environment Canada a) Create a graphical model of this data. b) Explain why y = c(a) will not quite fit the data. Consider the expected range of an exponential function. c) Determine whether y = c(a)" + b will fit the data. Explain why or why not; d) Determine an algebraic model for the data. Include all graphs, asymptotes, and equations you used. 4. a) Use your model from question 3 to predict the wind chill for a wind speed of 0 km/h, 100 km/h, and 200 km/h (hurricane force winds). Comment on the reasonableness of each answer. 5. The actual wind chill formula is W = 13.12 + 0.6215 x Tair - 11.37 x 10.16 + 0.3965 x Tair x 10-do, where W is the wind chill index, based on the Celsius temperature scale, Tair is the temperature in C, and V is the wind speed in kilometres per hour. Is this function model exponential? Explain. Determine the wind chill formula for a temperature of - 20"C. Comment on how well this model fits the data? How does it