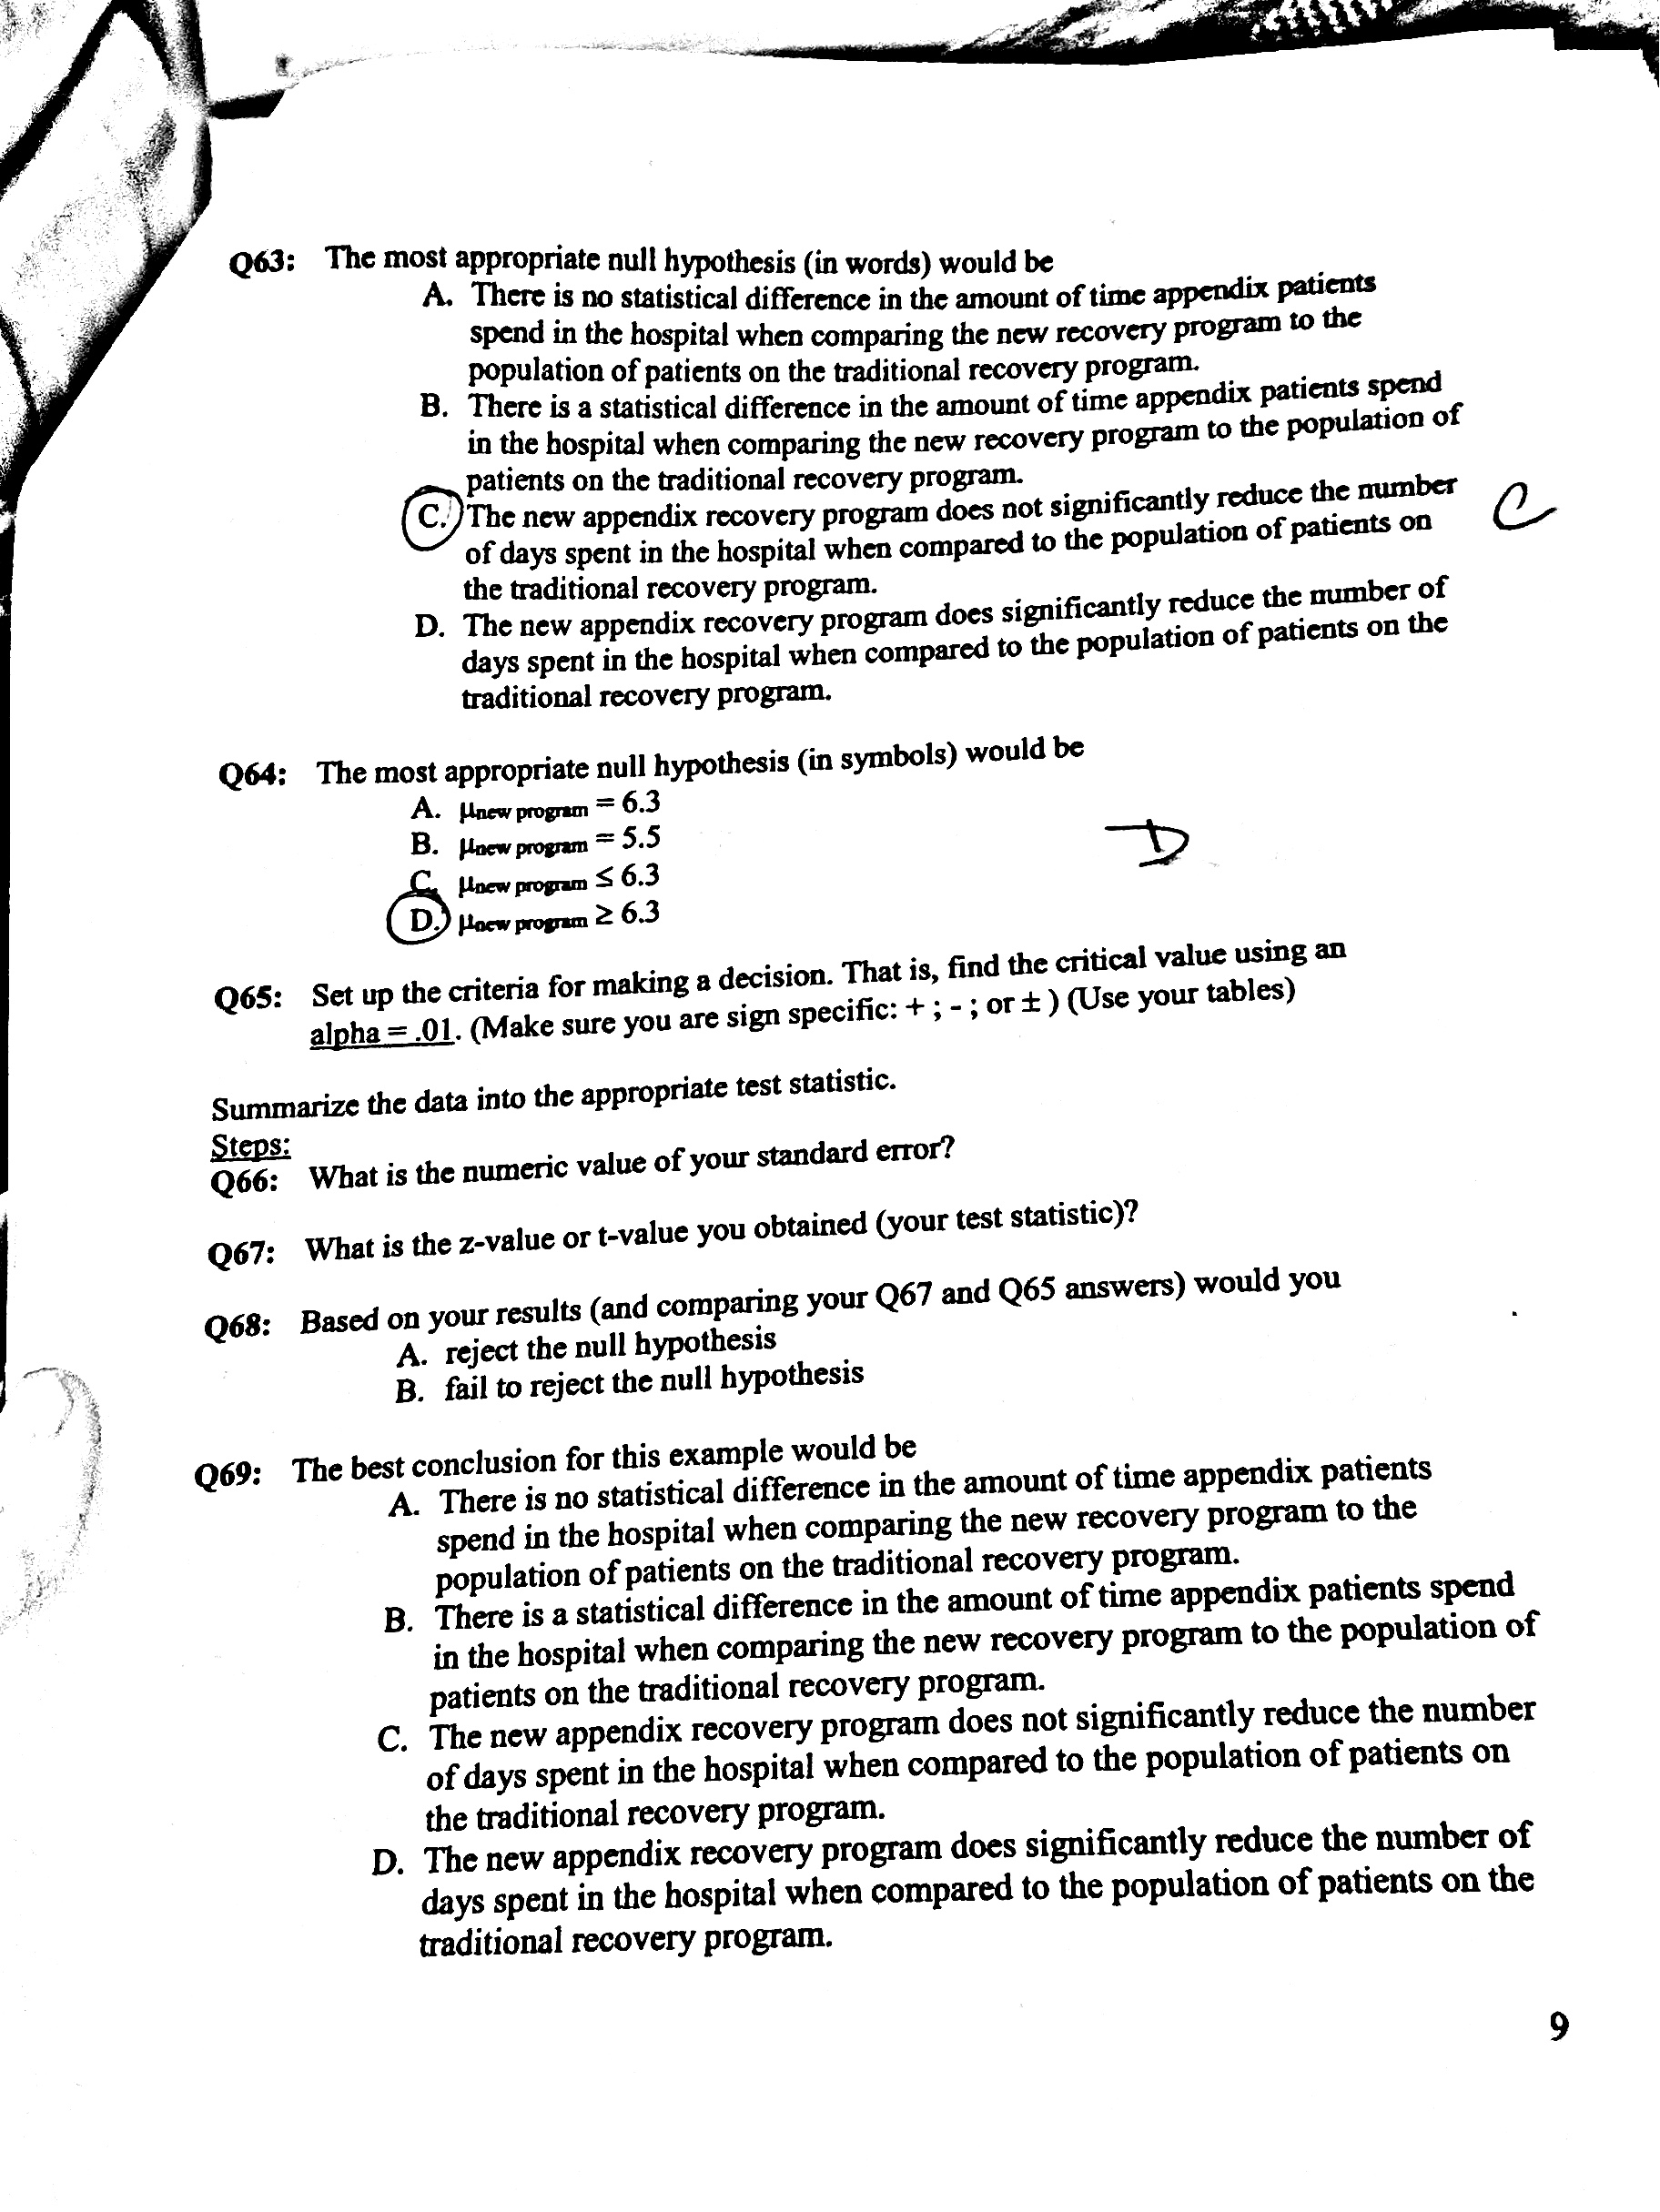
I need help with question 65 through 91 if possible?
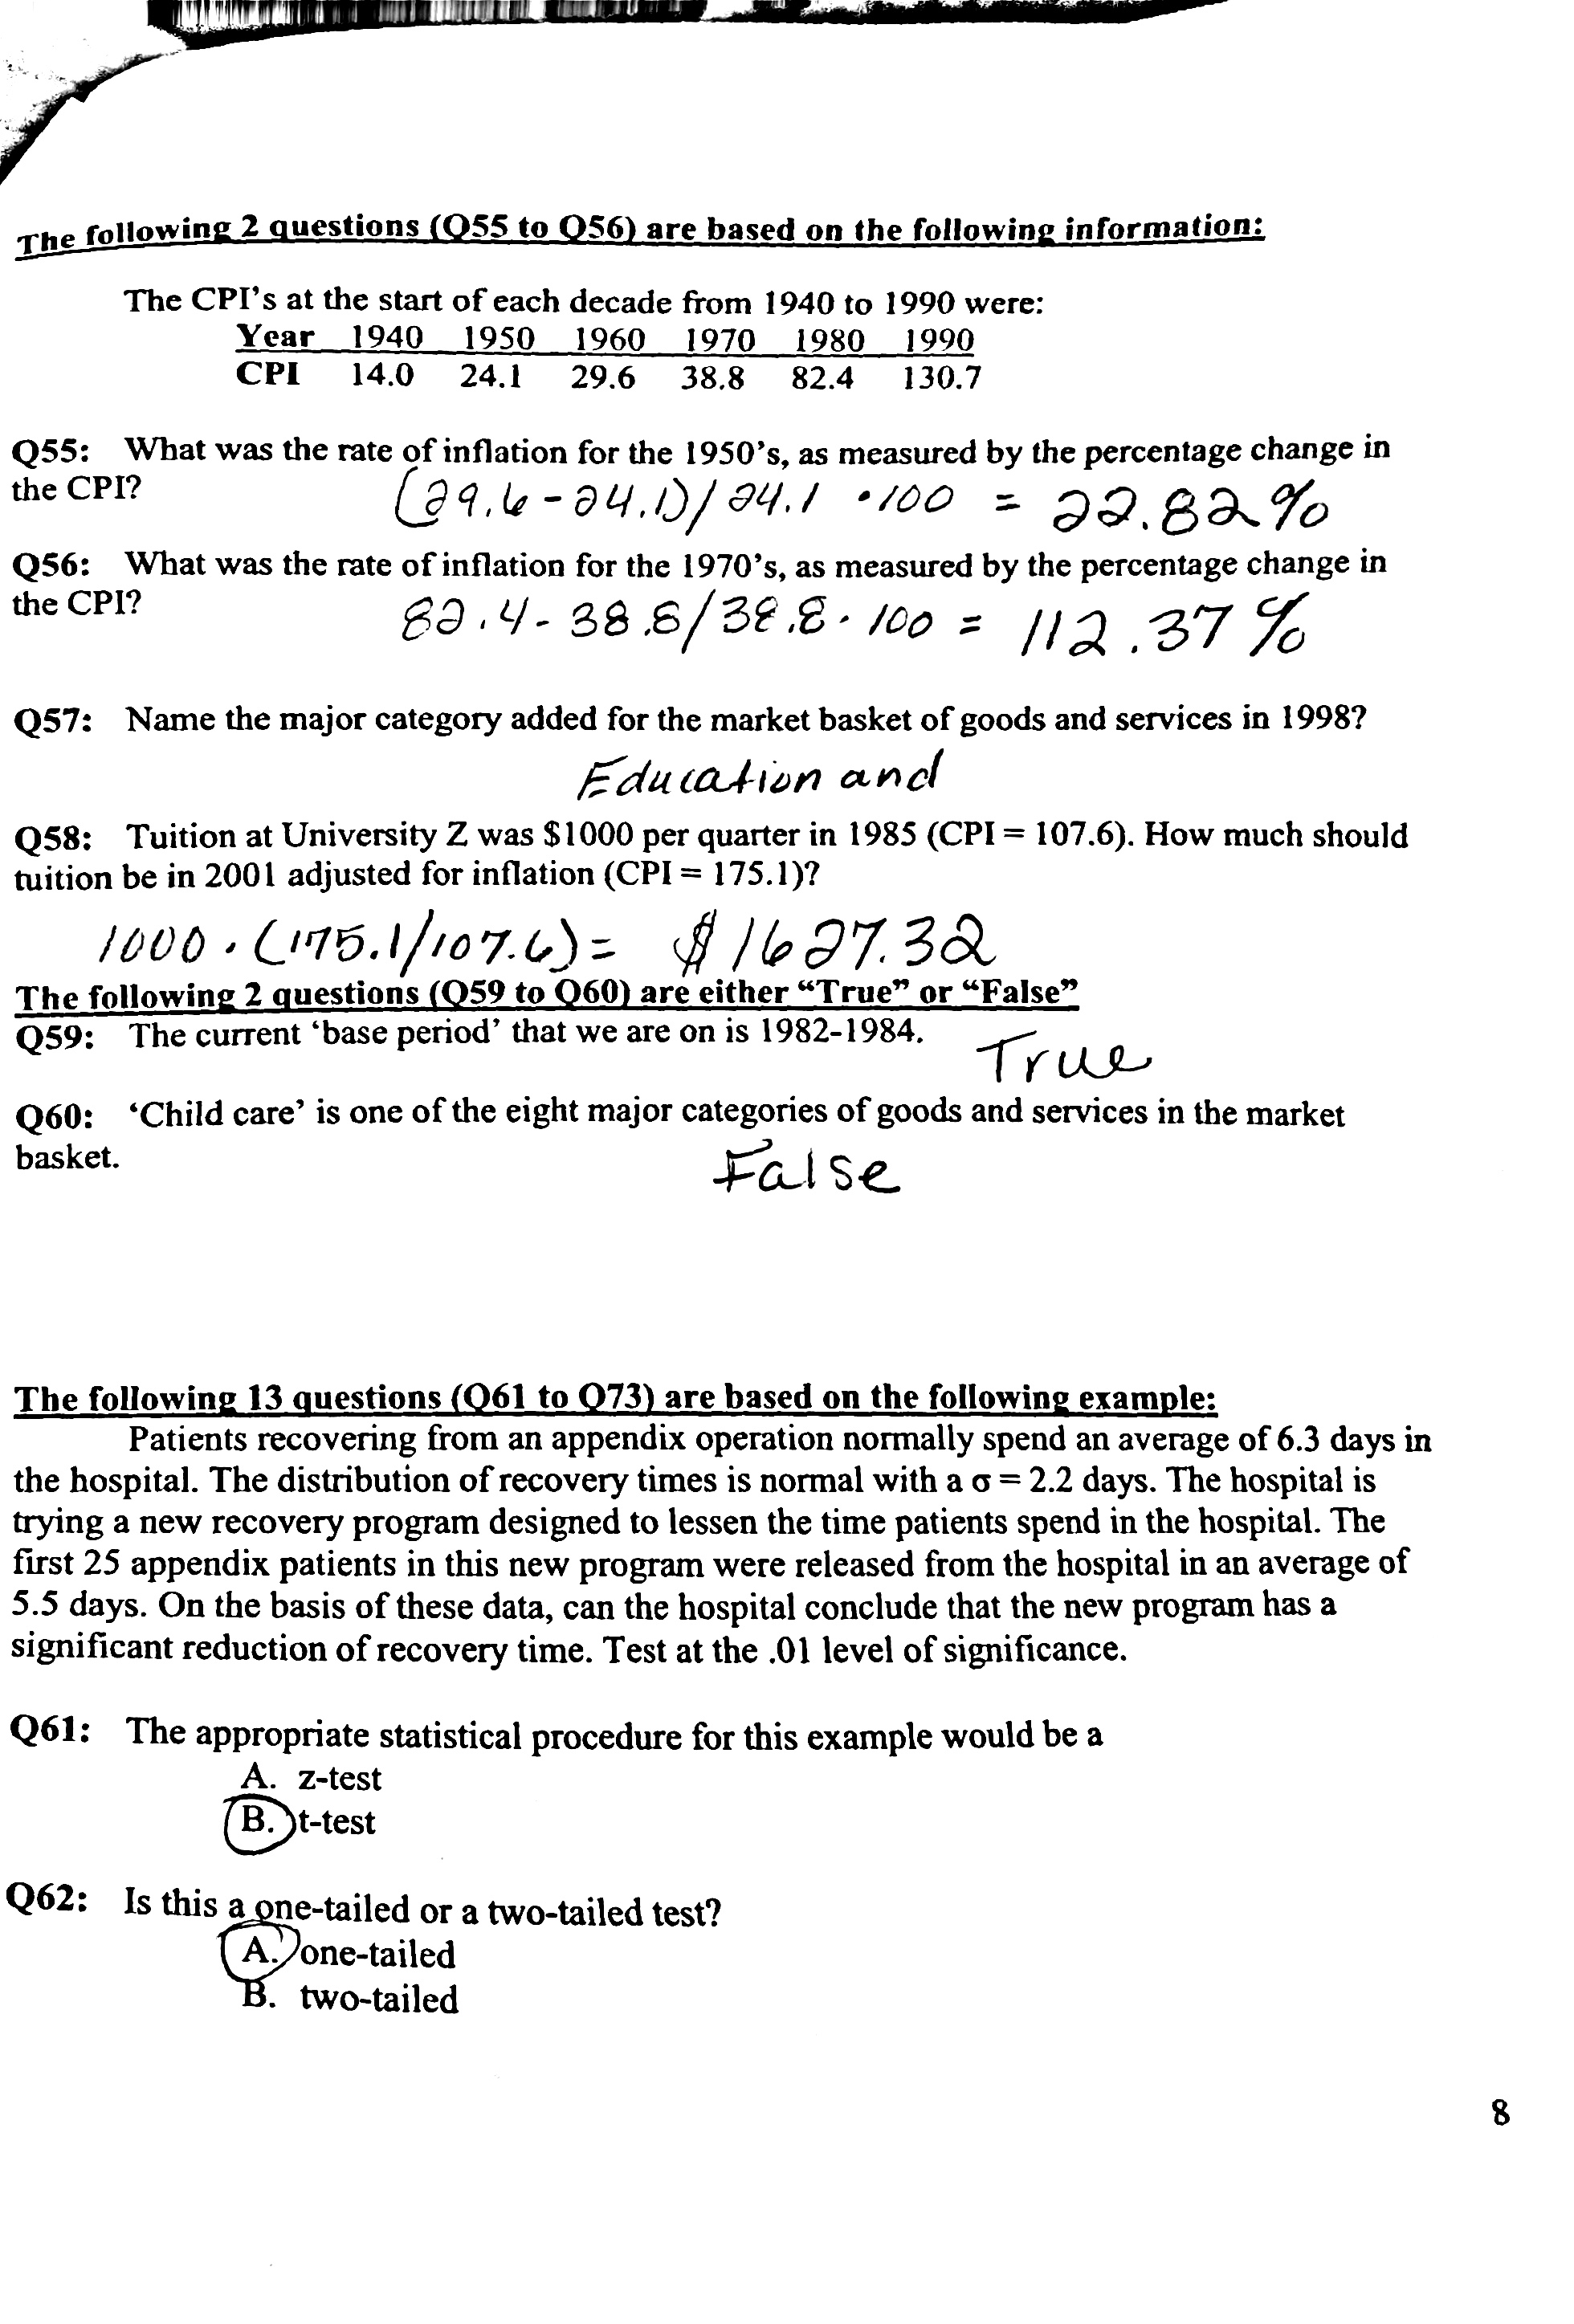
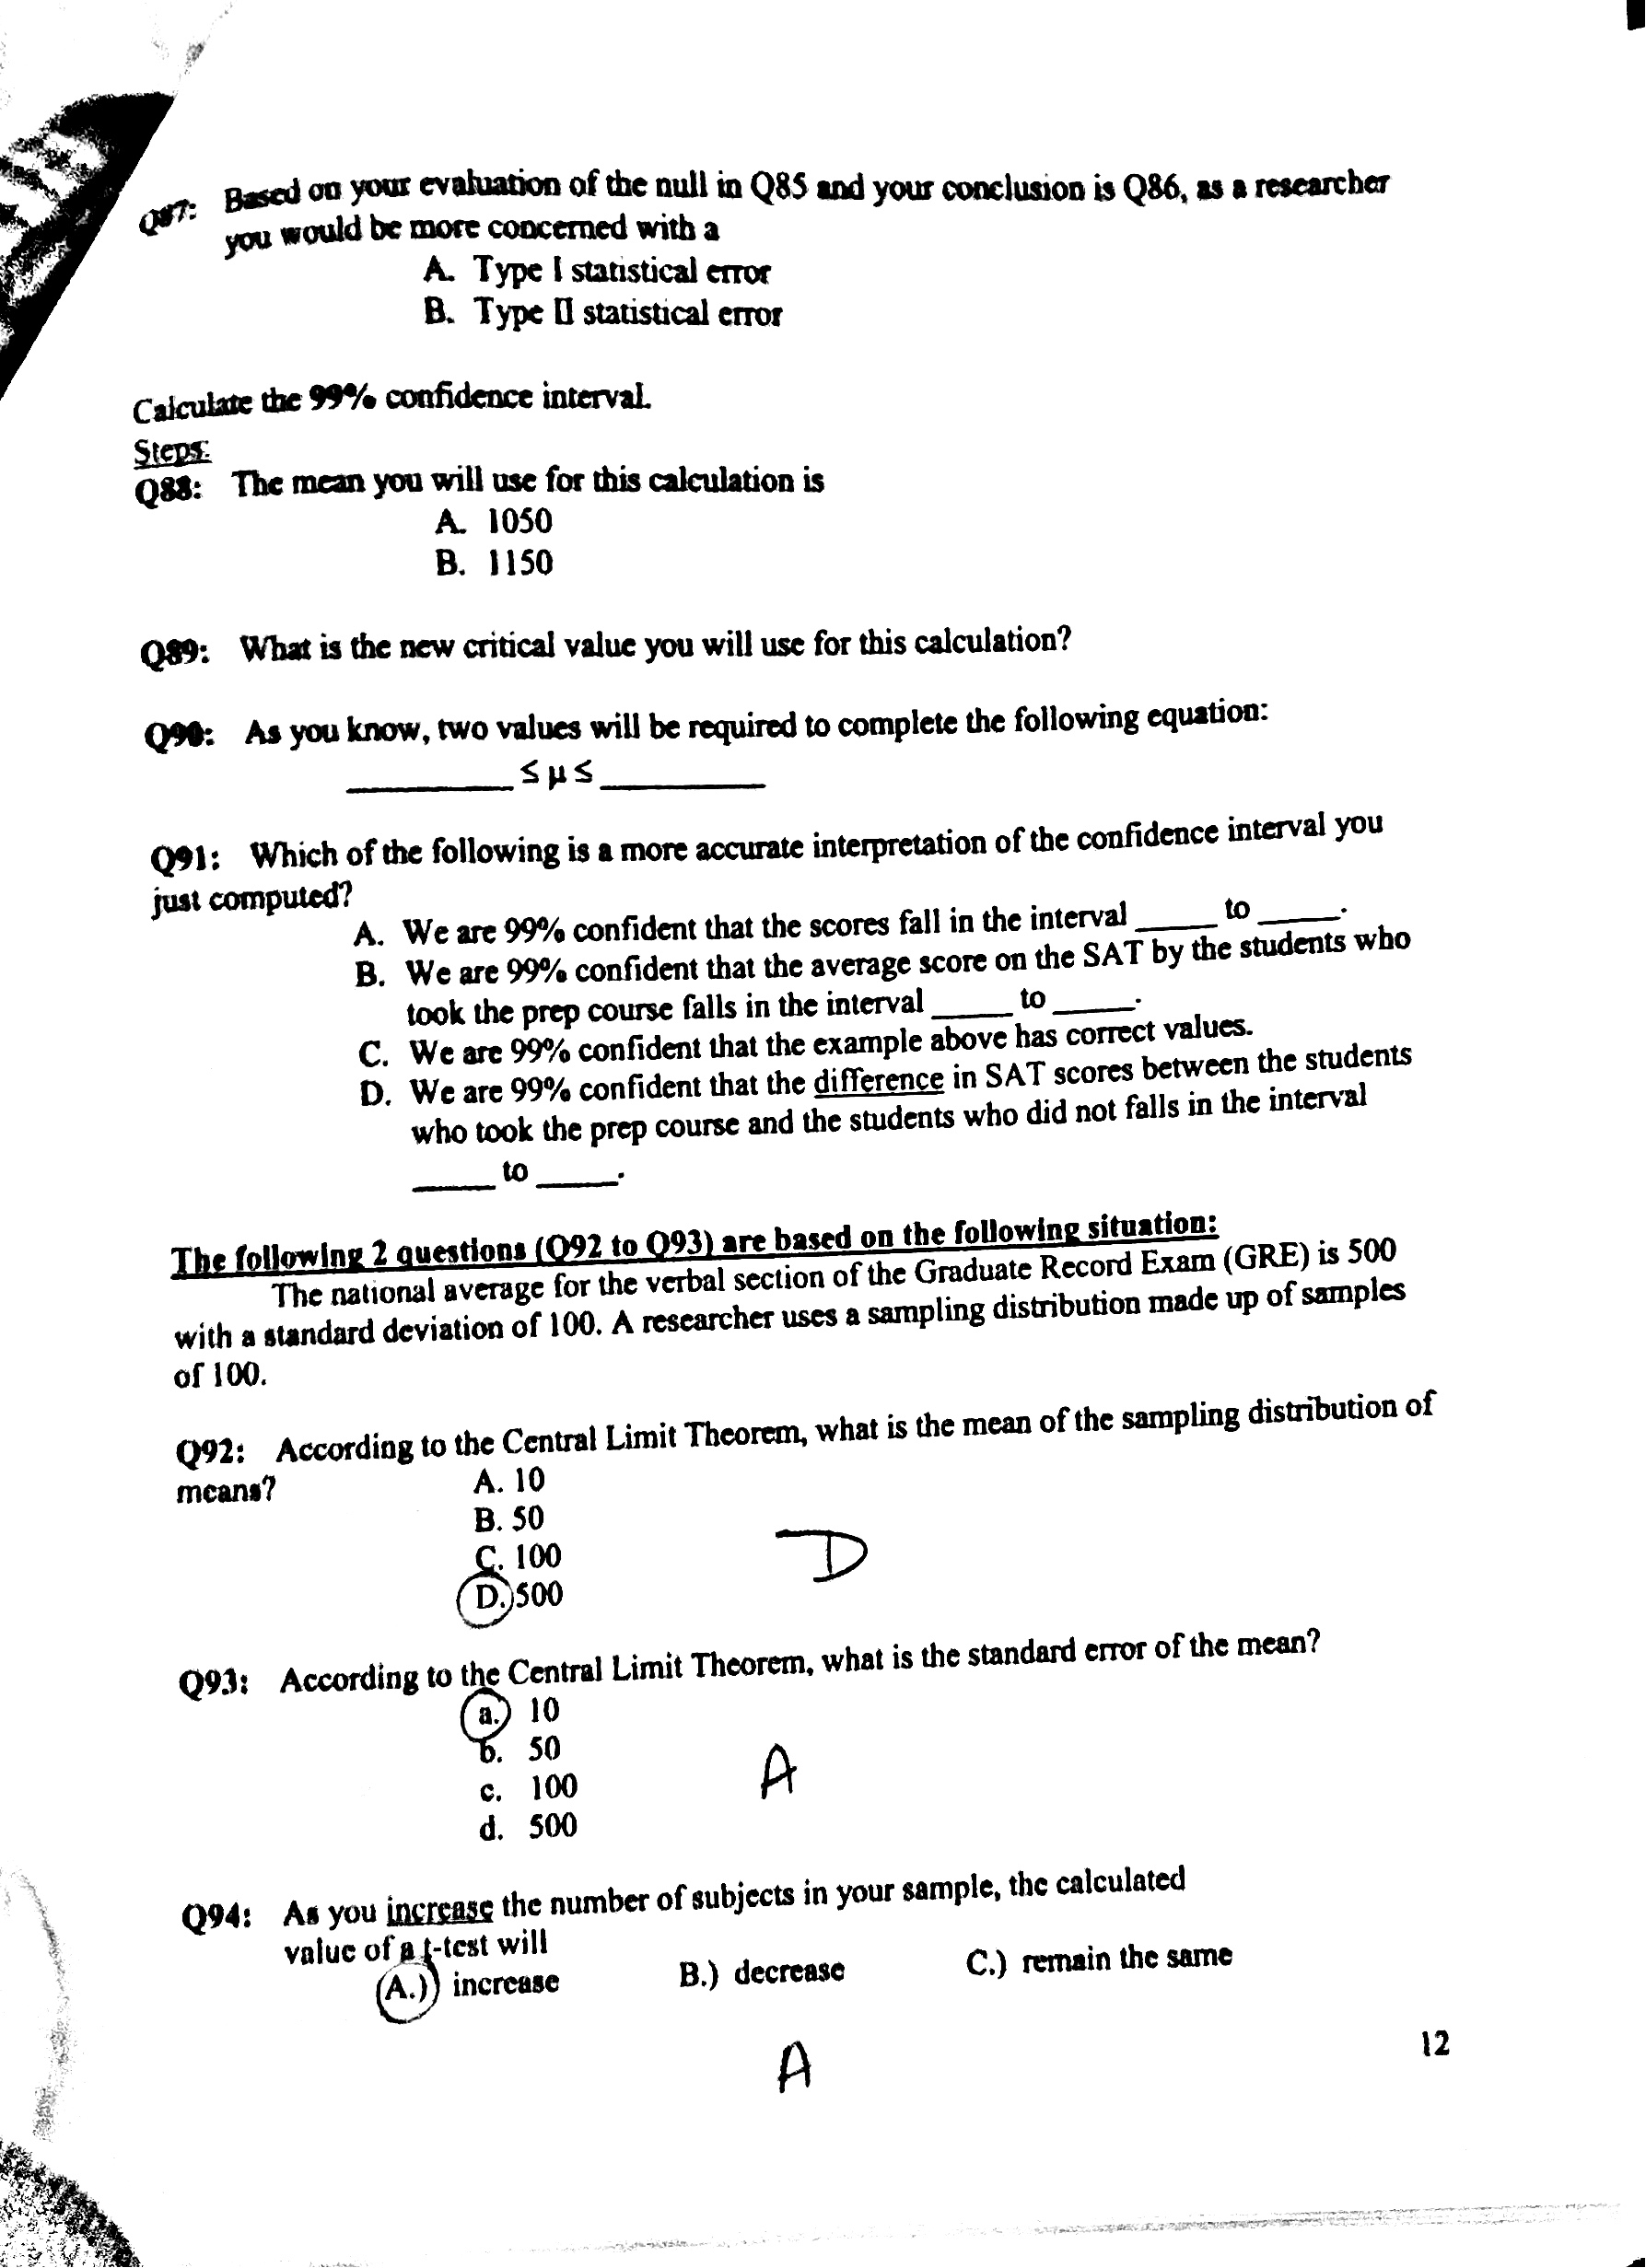
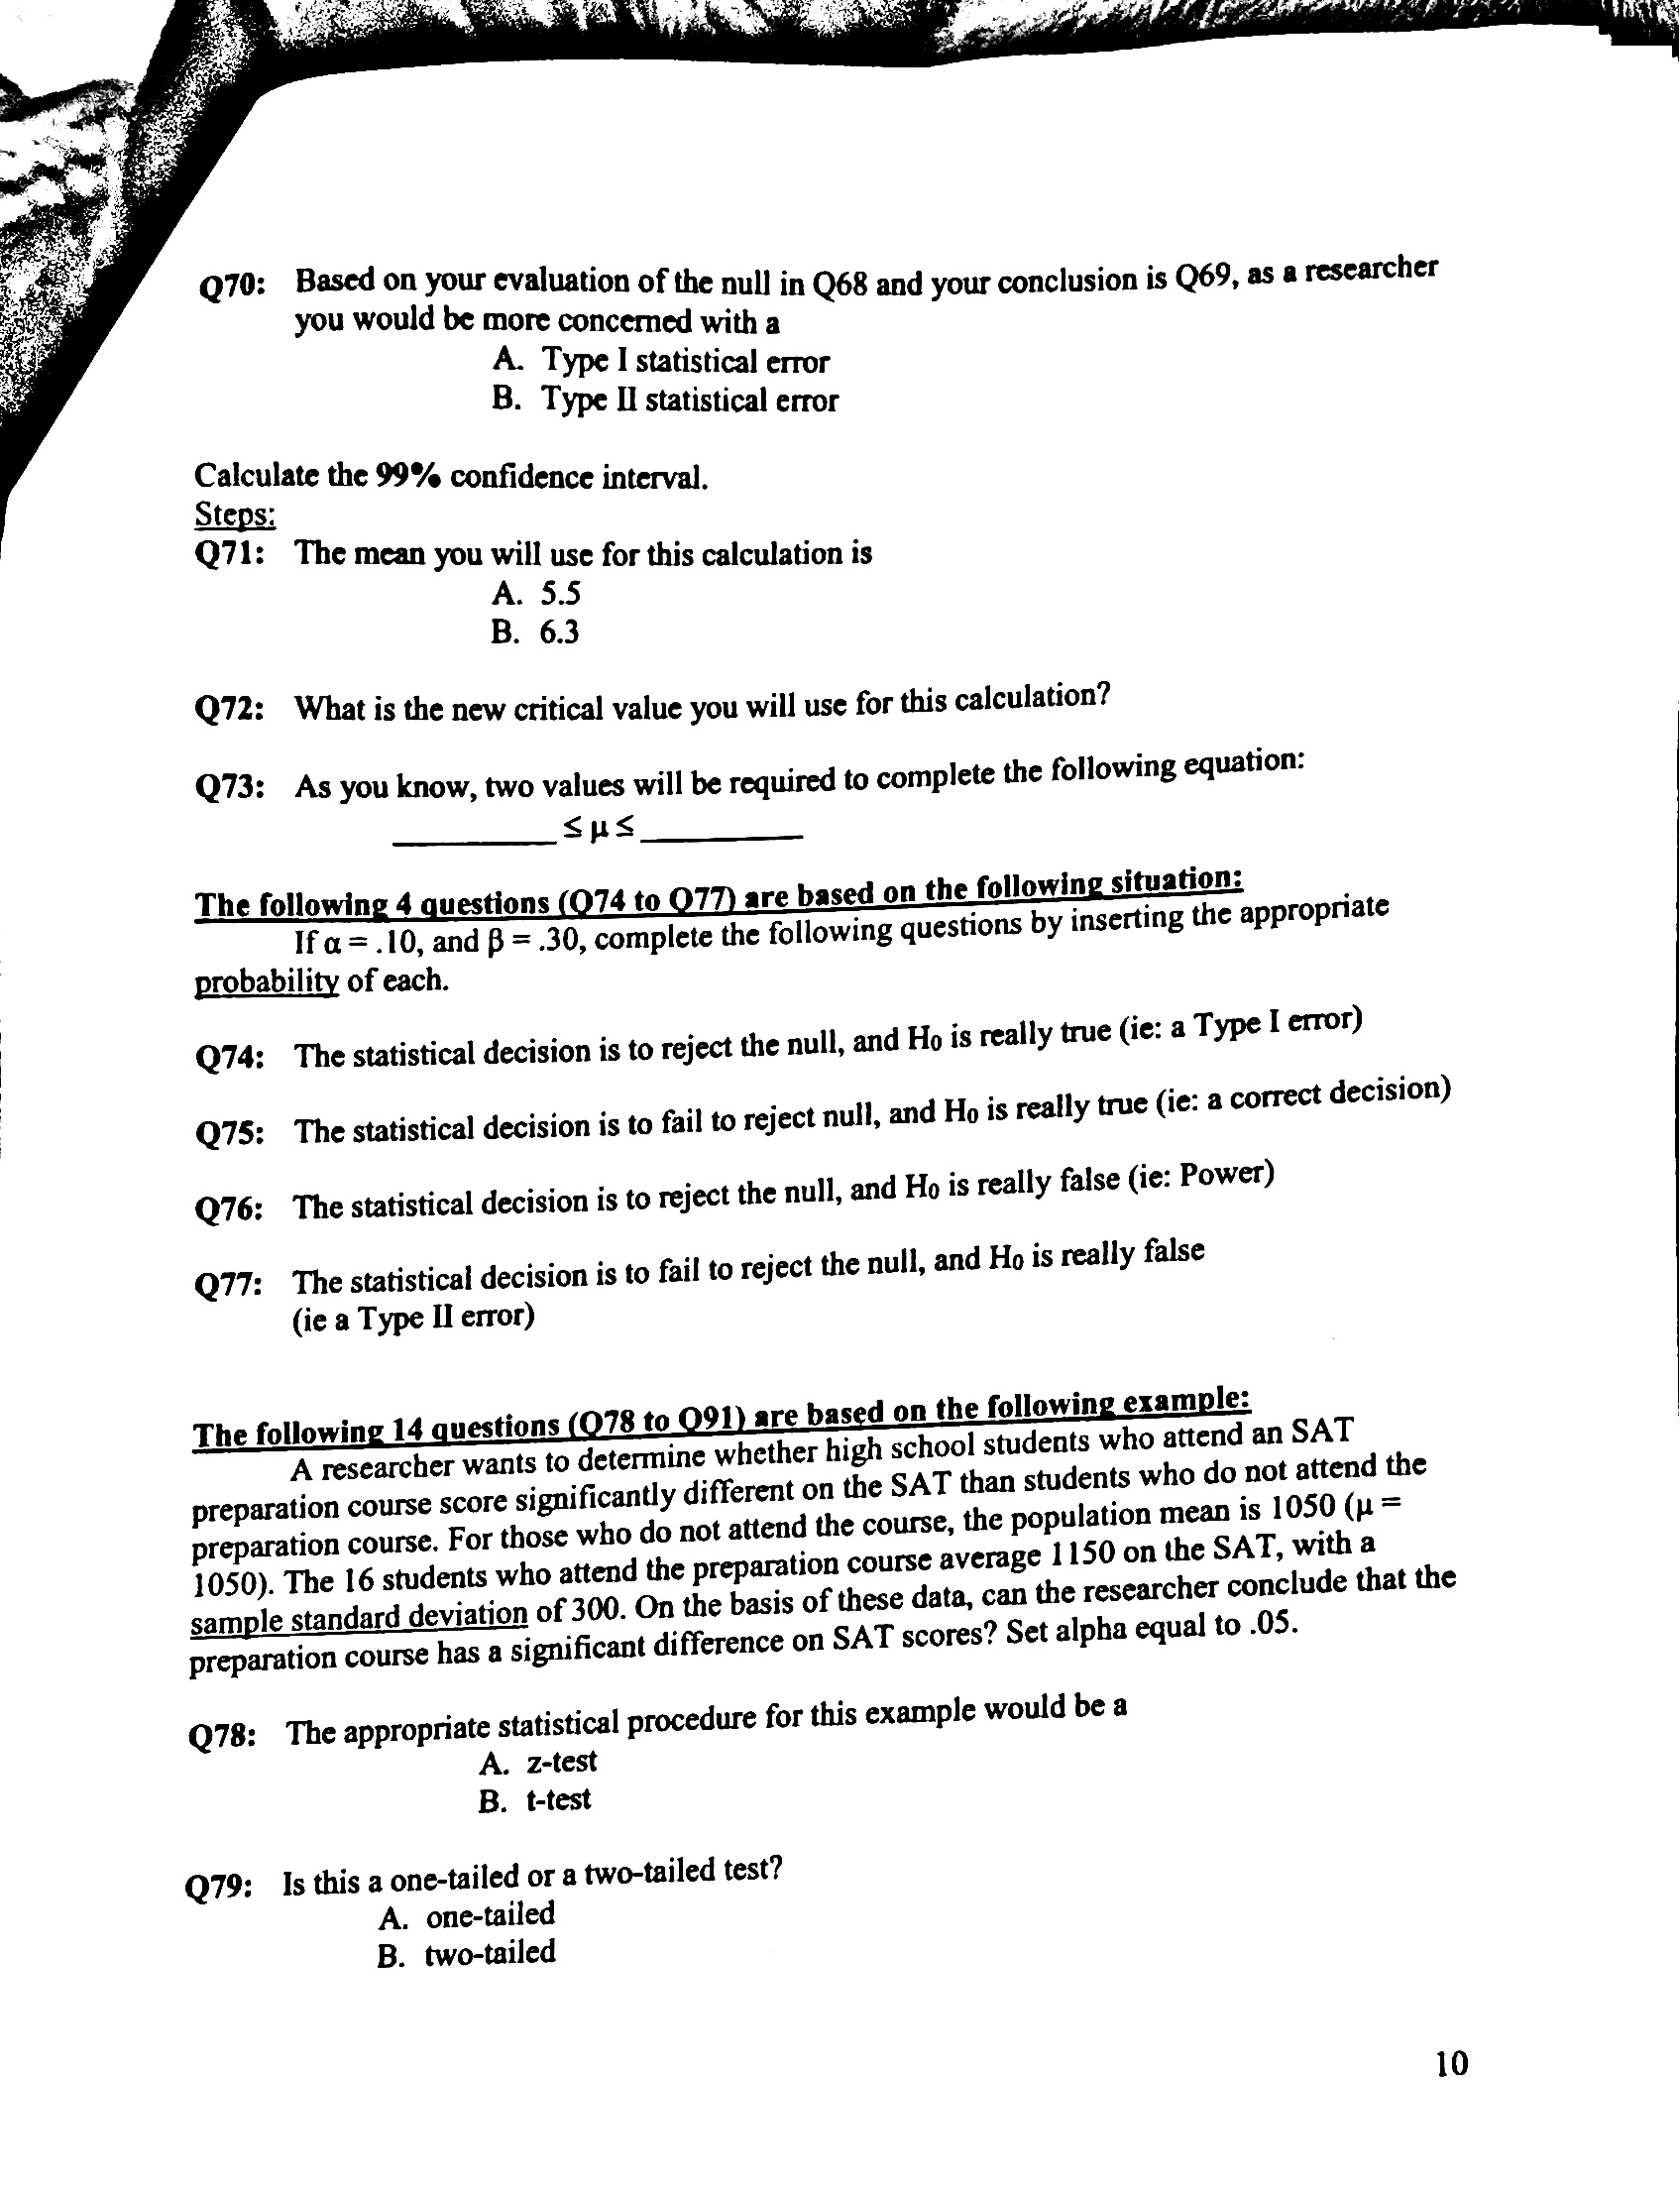
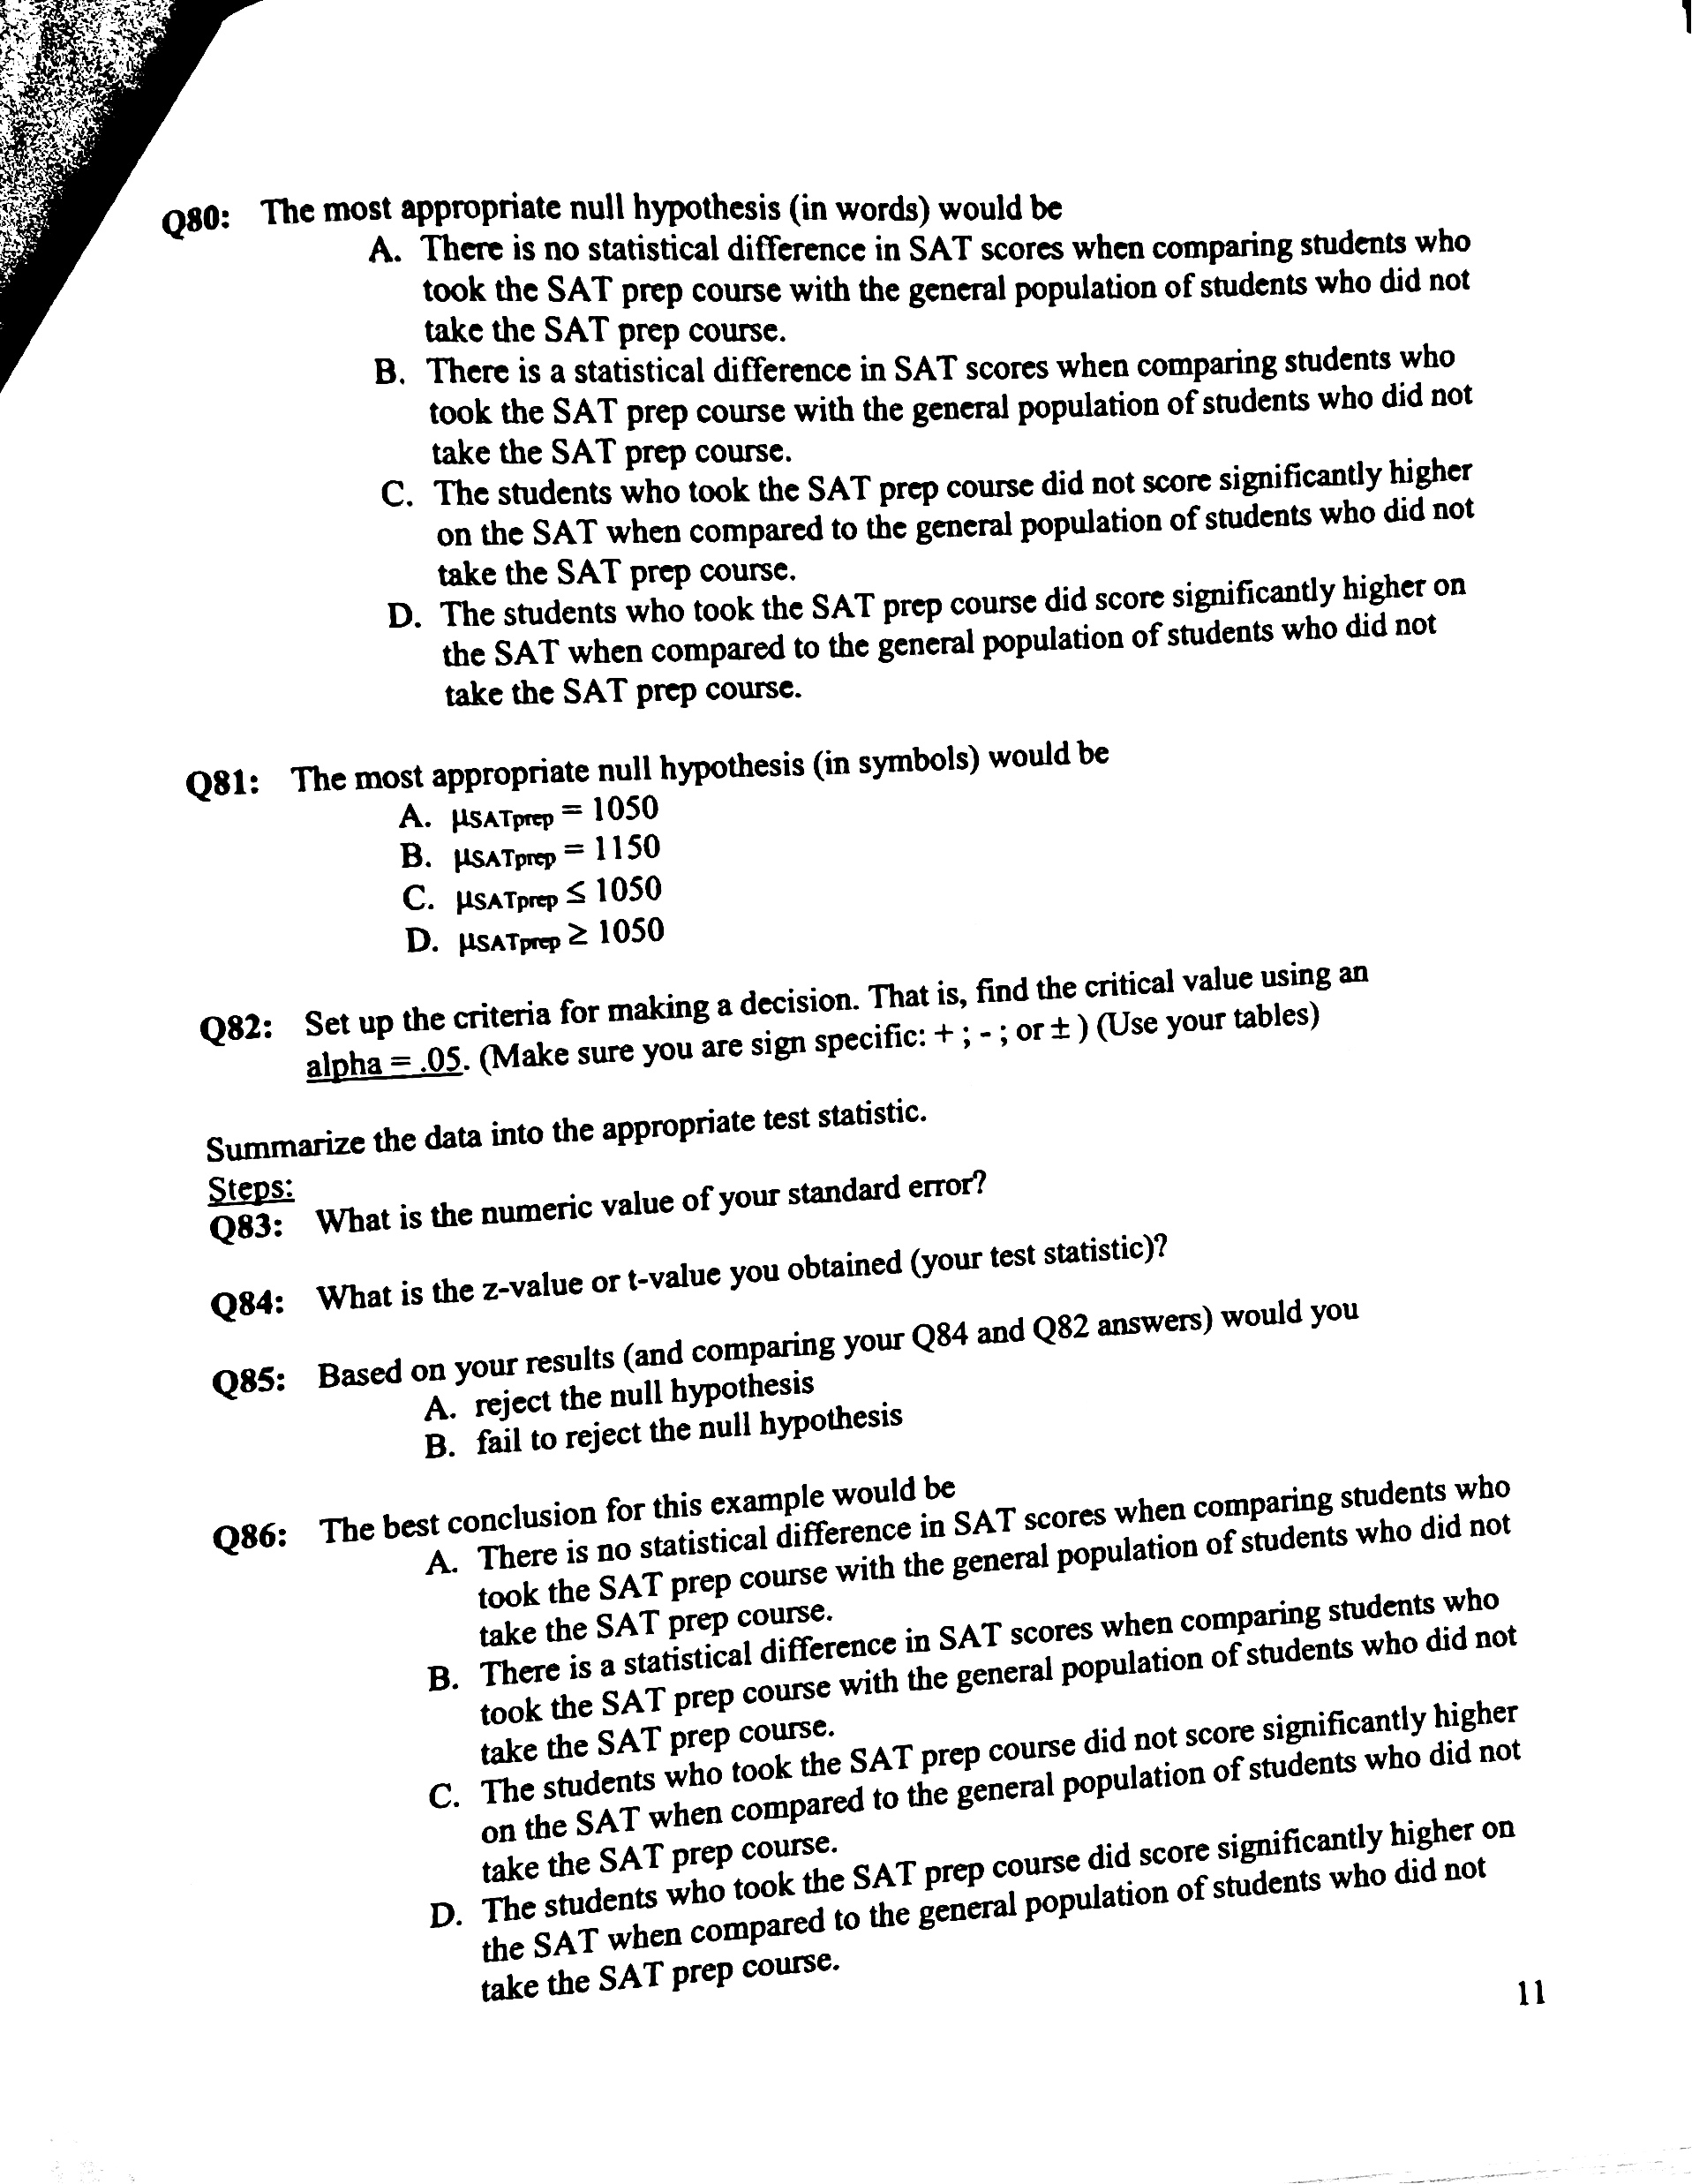
The following 2 questions (055 to Q56) are based on the following information: The CPI's at the start of each decade from 1940 to 1990 were: Year 1940 1950 1960 1970 1980 1990 CPI 14.0 24.1 29.6 38.8 82.4 130.7 the CPI? Q55: What was the rate of inflation for the 1950's, as measured by the percentage change in ( 29. 4 - 24. 1) / 24.1 . 100 = 22.820 the CPI? Q56: What was the rate of inflation for the 1970's, as measured by the percentage change in 82 . 4 - 38.8 / 38.8 . 100 = 112. 37 90 Q57: Name the major category added for the market basket of goods and services in 1998? Education and Q58: Tuition at University Z was $1000 per quarter in 1985 (CPI = 107.6). How much should tuition be in 2001 adjusted for inflation (CPI = 175.1)? 1000 . ( 175 . 1 / 107 . 6 ) = $ 1627.32 The following 2 questions (059 to (60) are either "True" or "False" Q59: The current "base period" that we are on is 1982-1984. True Q60: 'Child care' is one of the eight major categories of goods and services in the market basket. False The following 13 questions (Q61 to (73) are based on the following example: Patients recovering from an appendix operation normally spend an average of 6.3 days in the hospital. The distribution of recovery times is normal with a o = 2.2 days. The hospital is trying a new recovery program designed to lessen the time patients spend in the hospital. The first 25 appendix patients in this new program were released from the hospital in an average of 5.5 days. On the basis of these data, can the hospital conclude that the new program has a significant reduction of recovery time. Test at the .01 level of significance. Q61: The appropriate statistical procedure for this example would be a A. z-test B. t-test Q62: Is this a one-tailed or a two-tailed test? A. )one-tailed B. two-tailed 8087: Based on your evaluation of the null in Q85 and your conclusion is Q86, as a researcher you would be more concerned with a A. Type I statistical error B. Type U statistical error Calculate the 99% confidence interval. Steps 088: The mean you will use for this calculation is A. 1050 B. 1150 Q89: What is the new critical value you will use for this calculation? Qos: As you know, two values will be required to complete the following equation: SHS just computed? Q91: Which of the following is a more accurate interpretation of the confidence interval you A. We are 9% confident that the scores fall in the interval B. We are 99% confident that the average score on the SAT by the students who to took the prep course falls in the interval to C. We are 99% confident that the example above has correct values. D. We are 99% confident that the difference in SAT scores between the students who took the prep course and the students who did not falls in the interval to The following 2 questions (092 to (93) are based on the following situation: The national average for the verbal section of the Graduate Record Exam (GRE) is 500 with a standard deviation of 100. A researcher uses a sampling distribution made up of samples of 100. Q92: According to the Central Limit Theorem, what is the mean of the sampling distribution of means? A. 10 B. 50 C. 100 D. 500 D Q93: According to the Central Limit Theorem, what is the standard error of the mean? a. 6. 10 50 c. 100 A d. 500 Q94: As you increase the number of subjects in your sample, the calculated value of a f-test will (A.)) increase B.) decrease C.) remain the same A 12070: Based on your evaluation of the null in Q68 and your conclusion is Q69, as a researcher you would be more concerned with a A. Type I statistical error B. Type II statistical error Steps Calculate the 99% confidence interval. Q71: The mean you will use for this calculation is A. 5.5 B. 6.3 Q72: What is the new critical value you will use for this calculation? Q73: As you know, two values will be required to complete the following equation: SUS The following 4 questions (074 to (77) are based on the following situation: If a = .10, and B = .30, complete the following questions by inserting the appropriate probability of each. Q74: The statistical decision is to reject the null, and Ho is really true (ie: a Type I error) Q75: The statistical decision is to fail to reject null, and Ho is really true (ie: a correct decision) Q76: The statistical decision is to reject the null, and Ho is really false (ie: Power) Q77: The statistical decision is to fail to reject the null, and Ho is really false (ie a Type II error) The following 14 questions (078 to (91) are based on the following example: A researcher wants to determine whether high school students who attend an SAT preparation course score significantly different on the SAT than students who do not attend the preparation course. For those who do not attend the course, the population mean is 1050 (H = 1050). The 16 students who attend the preparation course average 1 150 on the SAT, with a sample standard deviation of 300. On the basis of these data, can the researcher conclude that the preparation course has a significant difference on SAT scores? Set alpha equal to .05. Q78: The appropriate statistical procedure for this example would be a A. z-test B. t-test Q79: Is this a one-tailed or a two-tailed test? A. one-tailed B. two-tailed 10Q80: The most appropriate null hypothesis (in words) would be A. There is no statistical difference in SAT scores when comparing students who took the SAT prep course with the general population of students who did not take the SAT prep course. B. There is a statistical difference in SAT scores when comparing students who took the SAT prep course with the general population of students who did not take the SAT prep course. C. The students who took the SAT prep course did not score significantly higher on the SAT when compared to the general population of students who did not take the SAT prep course. D. The students who took the SAT prep course did score significantly higher on the SAT when compared to the general population of students who did not take the SAT prep course. Q81: The most appropriate null hypothesis (in symbols) would be A. HSATprep = 1050 B. USATprep = 1150 C. HSATprep $ 1050 D. HSATprep 2 1050 Q82: Set up the criteria for making a decision. That is, find the critical value using an alpha = .05. (Make sure you are sign specific: + ; - ; or + ) (Use your tables) Summarize the data into the appropriate test statistic. Steps Q83: What is the numeric value of your standard error? Q84: What is the z-value or t-value you obtained (your test statistic)? Q85: Based on your results (and comparing your Q84 and Q82 answers) would you A. reject the null hypothesis B. fail to reject the null hypothesis Q86: The best conclusion for this example would be A. There is no statistical difference in SAT scores when comparing students who took the SAT prep course with the general population of students who did not take the SAT prep course. B. There is a statistical difference in SAT scores when comparing students who took the SAT prep course with the general population of students who did not take the SAT prep course. C. The students who took the SAT prep course did not score significantly higher on the SAT when compared to the general population of students who did not take the SAT prep course. D. The students who took the SAT prep course did score significantly higher on the SAT when compared to the general population of students who did not take the SAT prep course. 11Q63: The most appropriate null hypothesis (in words) would be A. There is no statistical difference in the amount of time appendix patients spend in the hospital when comparing the new recovery program to the population of patients on the traditional recovery program. B. There is a statistical difference in the amount of time appendix patients spend in the hospital when comparing the new recovery program to the population of C. patients on the traditional recovery program. The new appendix recovery program does not significantly reduce the number of days spent in the hospital when compared to the population of patients on he traditional recovery program. D. The new appendix recovery program does significantly reduce the number of days spent in the hospital when compared to the population of patients on the traditional recovery program. Q64: The most appropriate null hypothesis (in symbols) would be A. Hnew program = 6.3 B. Hnew program = 5.5 Hnew program $ 6.3 D How program 2 6.3 Q65: Set up the criteria for making a decision. That is, find the critical value using an alpha = .01. (Make sure you are sign specific: + ; - ; or t ) (Use your tables) Summarize the data into the appropriate test statistic. Steps: Q66: What is the numeric value of your standard error? Q67: What is the z-value or t-value you obtained (your test statistic)? Q68: Based on your results (and comparing your Q67 and Q65 answers) would you A. reject the null hypothesis B. fail to reject the null hypothesis Q69: The best conclusion for this example would be A. There is no statistical difference in the amount of time appendix patients spend in the hospital when comparing the new recovery program to the population of patients on the traditional recovery program B. There is a statistical difference in the amount of time appendix patients spend in the hospital when comparing the new recovery program to the population of patients on the traditional recovery program. C. The new appendix recovery program does not significantly reduce the number of days spent in the hospital when compared to the population of patients on the traditional recovery program. D. The new appendix recovery program does significantly reduce the number of days spent in the hospital when compared to the population of patients on the traditional recovery program. 9
