Answered step by step
Verified Expert Solution
Question
1 Approved Answer
I need help with round 1 of CAPSIM COMP-Xm exam. Round 0 Inquirer Research & Development DRAFT SAVED AT Apr 11, 2020 10 CAM MOT
I need help with round 1 of CAPSIM COMP-Xm exam. 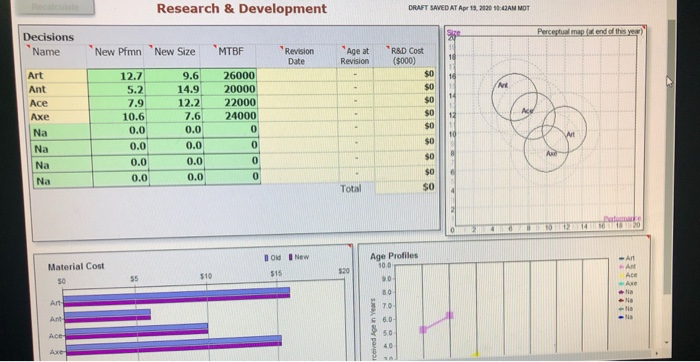

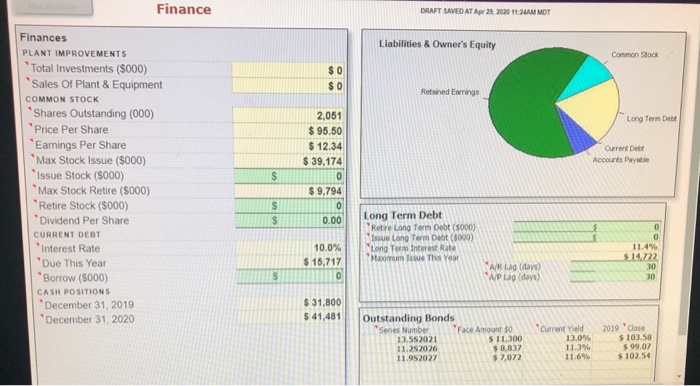
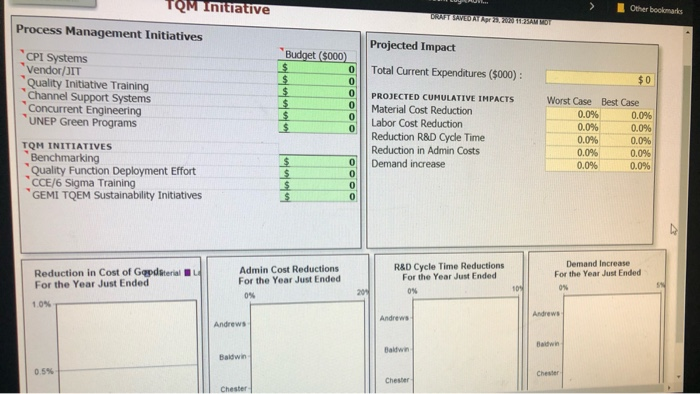
Round 0 Inquirer 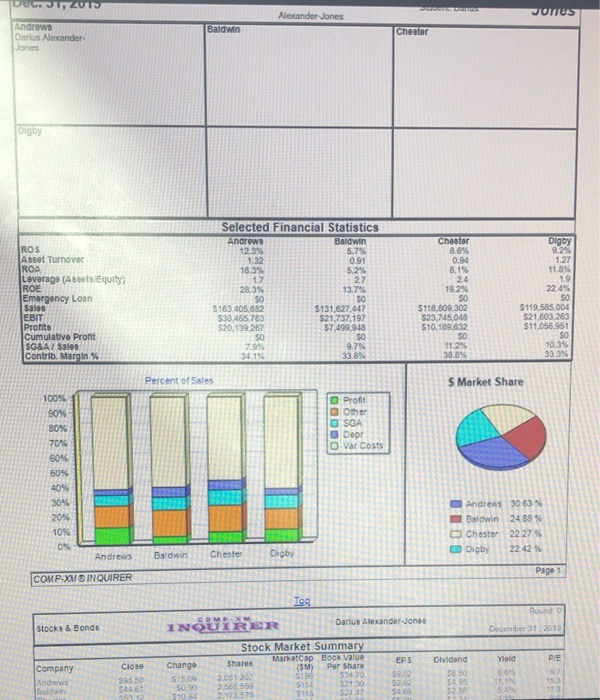
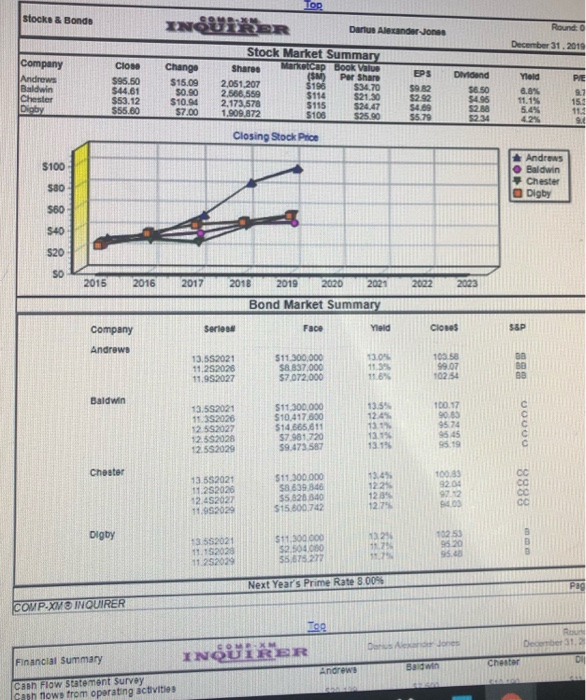
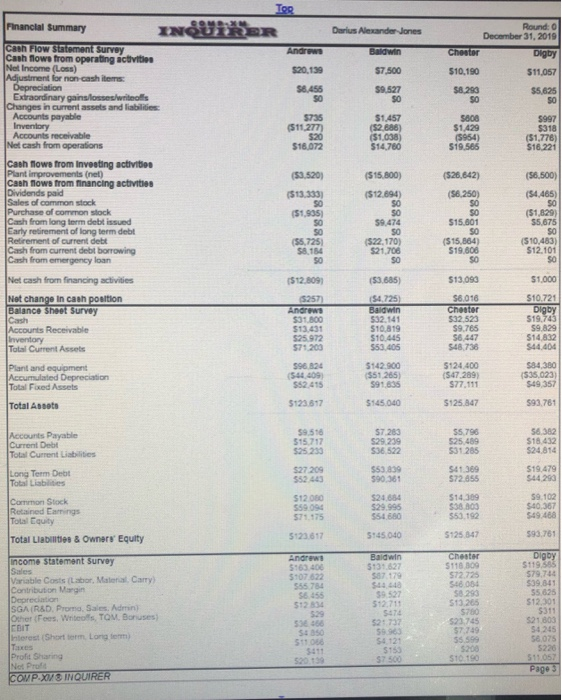
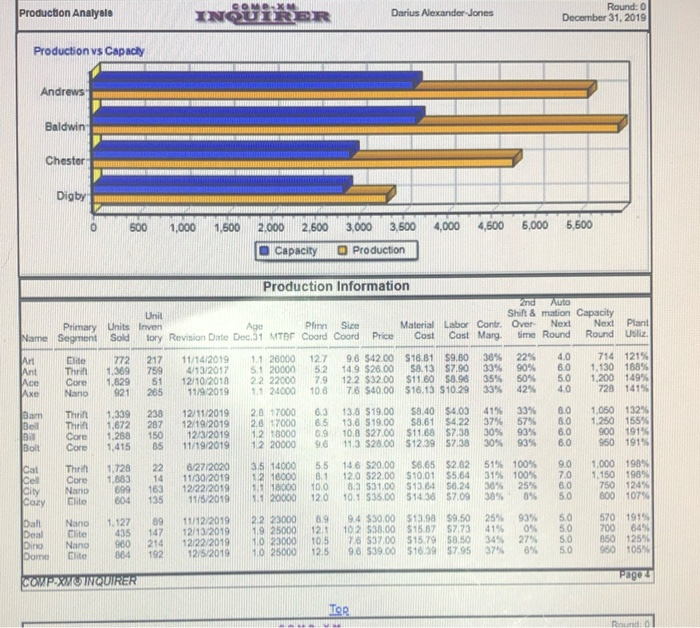
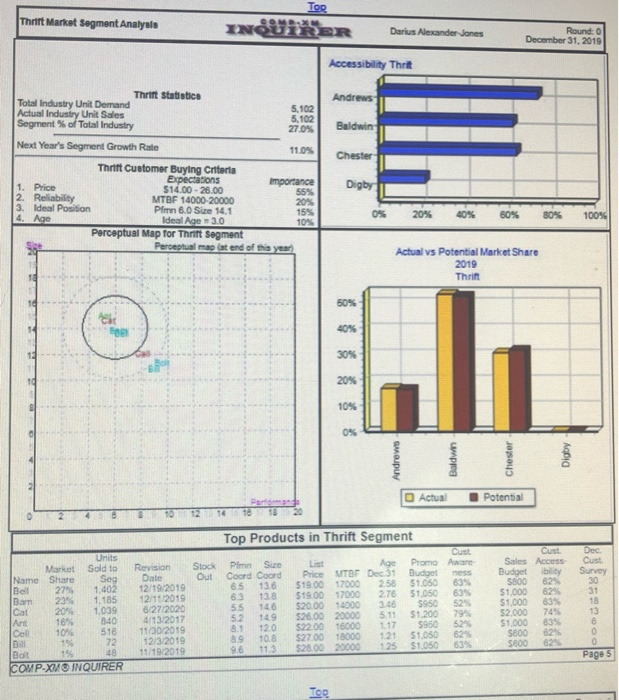
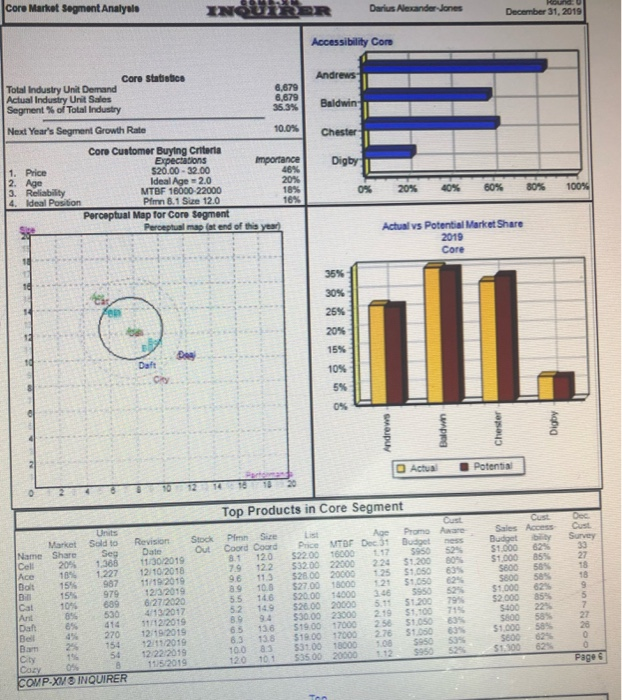
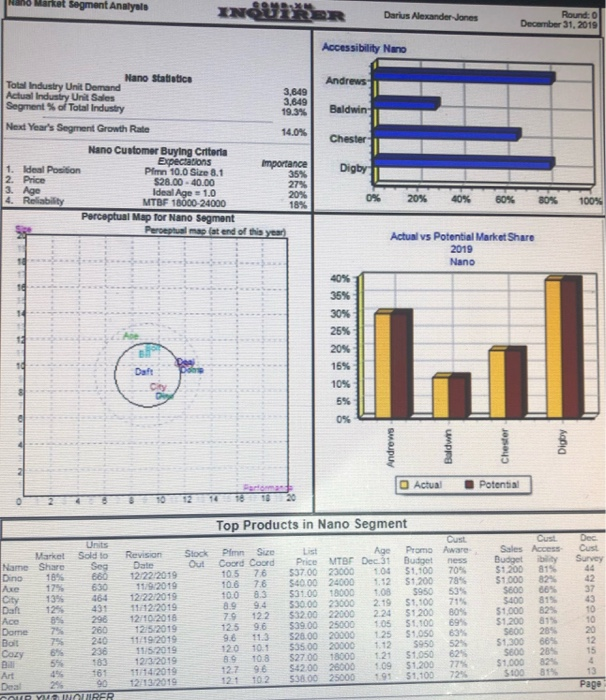
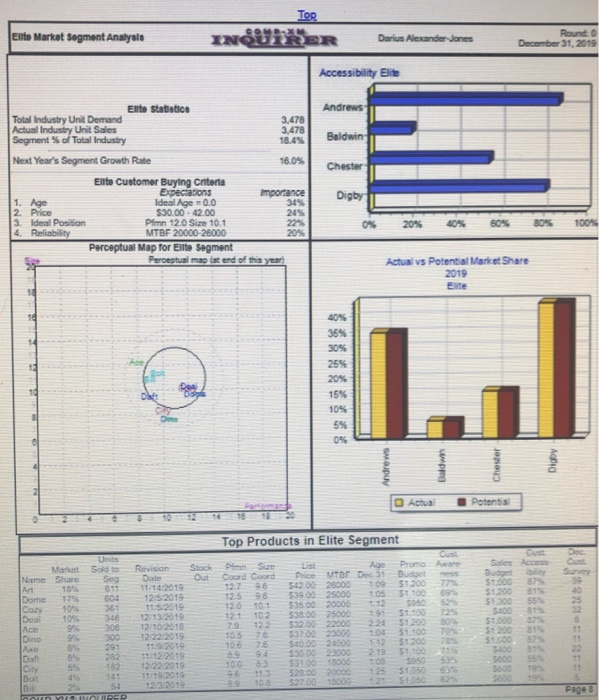
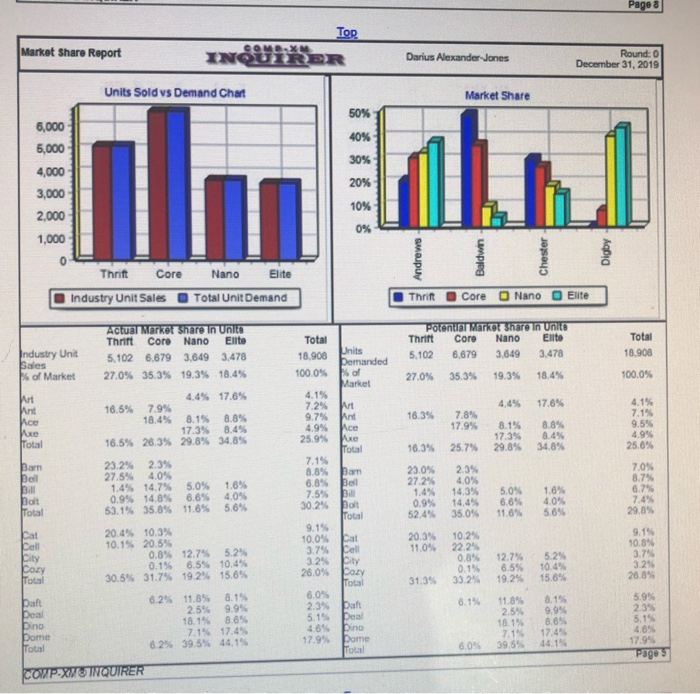
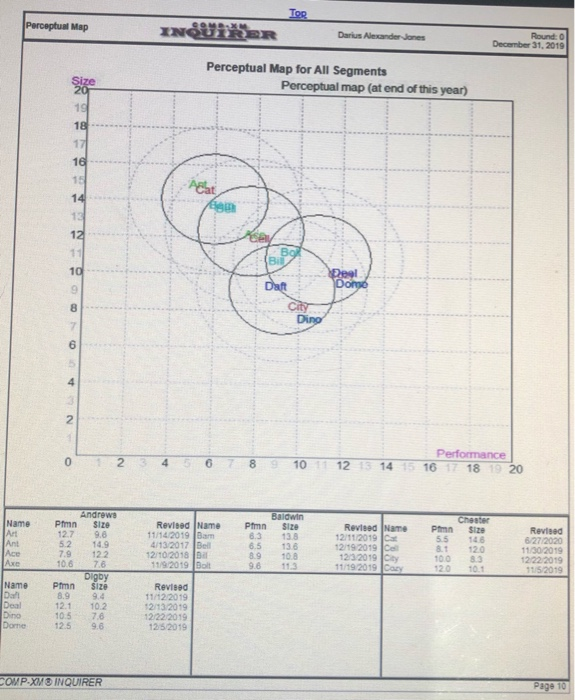
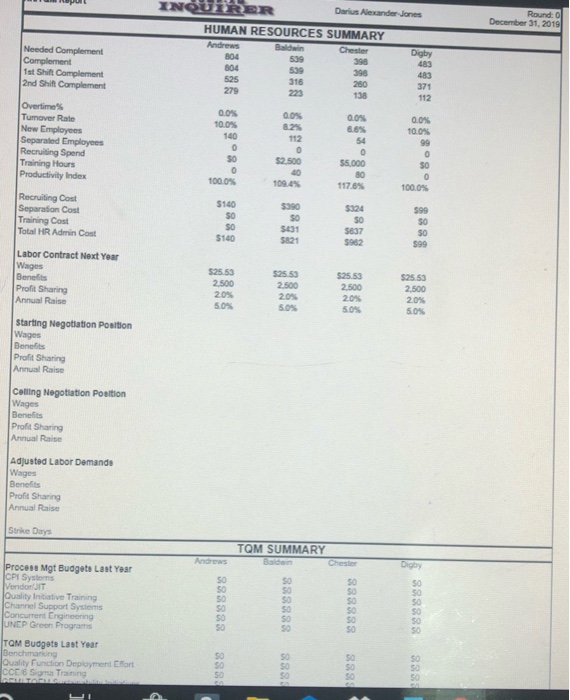
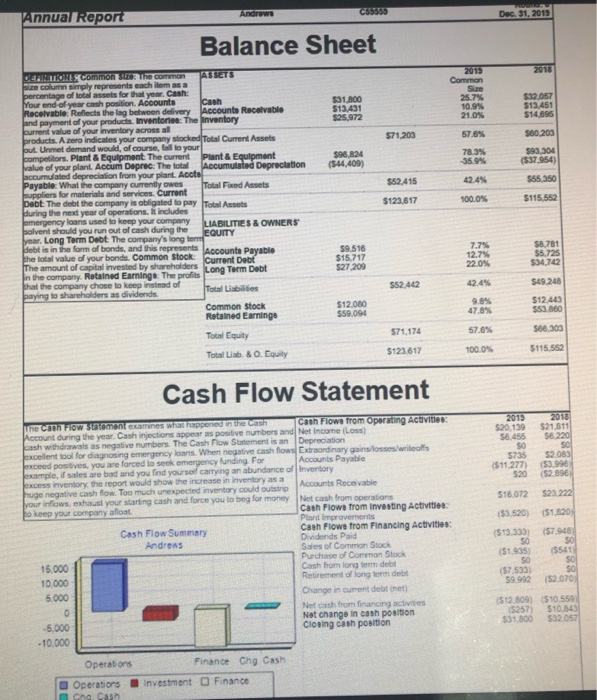
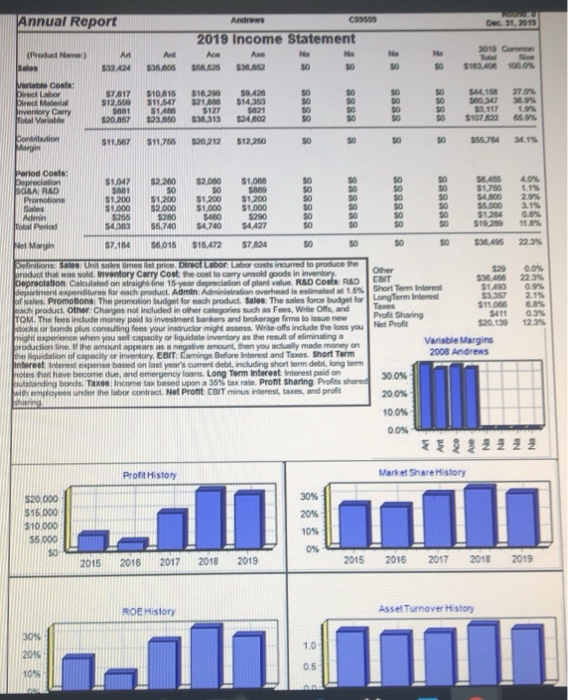
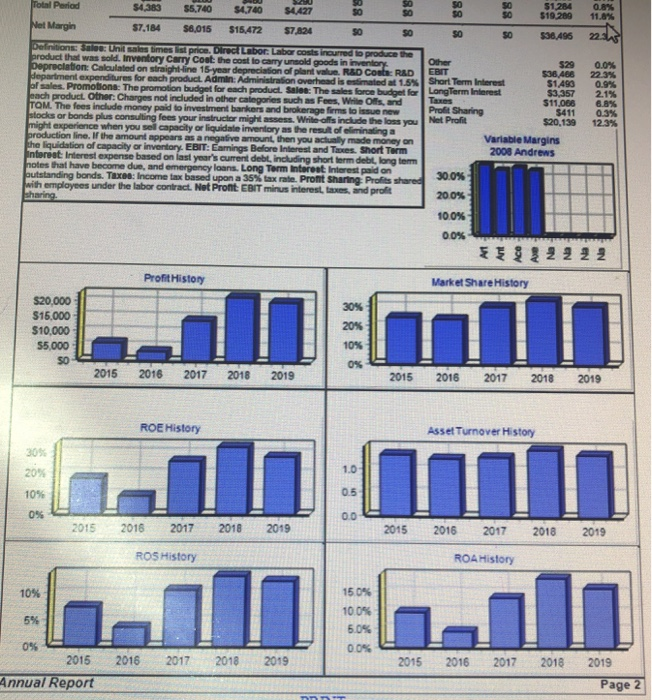
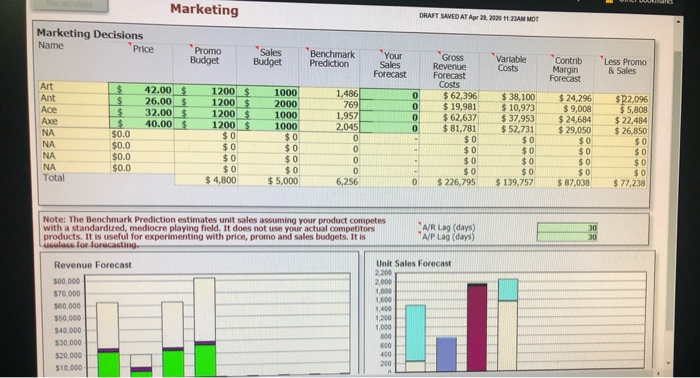
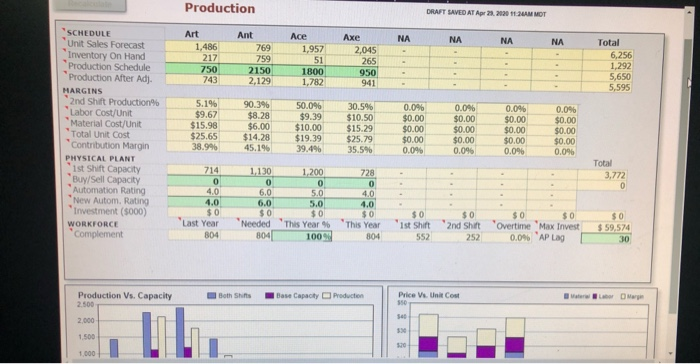
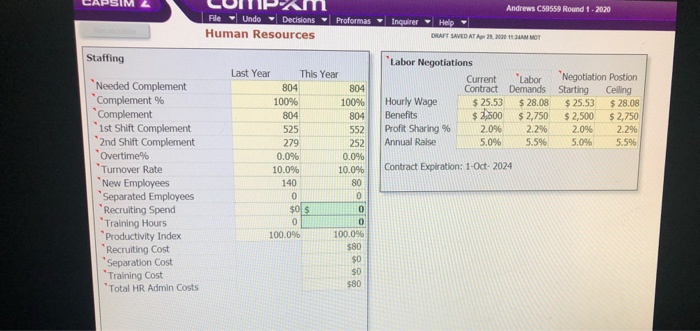
Research & Development DRAFT SAVED AT Apr 11, 2020 10 CAM MOT Perceptual map ( end of this year) Decisions Name New Pfmn New Size MTBF Revision Date Age at Revision R&D Cost (5000) Art Ant Ace Axe 12.7 5.2 7.9 9.6 14.9 12.2 26000 20000 22000 24000 7.6 Na 0.0 Na 0 Total Age Profiles Material Cost in Years rceived Marketing DRAFT SAVED AT Apr 21, 2020 11:23AM MOT Marketing Decisions Name Price Promo Sales Budget Budget Benchmark Prediction "Your GEOSS Sales Forecast "Variable Costs Contrib Margin Forecast "Less Promo & Sales $ Ant Ace Axe 42.00 $ 26.00 $ 32.00$ 40.00 $ 1200 $ 1200 $ 1200 $ 1200 $ $0 $0 1000 2000 1000 1000 1,486 769 1,957 2,0451 Revenue Forecast Costs $ 62,396 $ 19,981 $ 62,637 $81.781 $0 $ $ $ $0.0 $0.0 $0.0 $0.0 $ 38,100 $ 10,973 $ 37,953 $ 52.731 $ 24,296 $ 9,008 $ 24,684 $ 29,050 $22,096 $ 5,808 $ 22,484 $ 26,850 NA $o NA $0 0 $0 $0 $0 $0 NA NA Total $0 $0 $0 $ 5,000 So $0 $4,800 $0 $0 6,256 0 $ 226,795 $ 139,757 $0 $ 87,038 $77,238 Note: The Benchmark Prediction estimates unit sales assuming your product competes with a standardized, mediocre playing field. It does not use your actual competitors products. It is useful for experimenting with price, promo and sales budgets. It is usulace for forecasting A/R Lag (days) "A/P Lag (days) Unit Sales Forecast Revenue Forecast 580,000 570.000 500.000 550.000 $40.000 $30,000 $20,000 510,000 Production DRAFT SAVED AT Apr 21, 2020 1.2M MOT Ace Axe NA NA NA Art 1.486 217 750 743 Ant 769 759 2150 2,129 1.957 51 1800 2,045 265 950 Total 6,256 1,292 5,650 5.595 1,782 941 0.0% $0.00 SCHEDULE Unit Sales Forecast Inventory On Hand Production Schedule Production After Adj. MARGINS 2nd Shift Production% Labor Cost/Unit Material Cost/Unit Total Unit Cost Contribution Margin PHYSICAL PLANT 1st Shift Capacity Buy/Sell Capacity Automation Rating New Autom. Rating Investment (5000) WORKFORCE Complement 5.19 $9.67 $15.98 $25.65 38.99 90.396 $8.28 $6.00 $14.28 45.196 50.096 $9.39 $10.00 $19.39 39.496 30.5% $10.50 $15.29 $25.79 35.5% 0.096 $0.00 $0.00 $0.00 0.0% 0.0% $0.00 $0.00 $0.00 0.096 $0.00 $0.00 0.046 $0.00 $0.00 $0.00 0.0% 0.096 714 1.130 1,200 728 Total 3,772 0 6.0 4.0 6.0 5.0 5.0 4.0 $0 $ ast Year 804 $0 "Needed 804 'ist Shift "This Year 100 This Year 804 $0 Overtime Max Invest 0.0% AP Lag 2nd Shift 252 $0 $ 59,574 552 30 Production Vs. Capacity Both Shirts Base Capacity Price Ve Unit Cost WEBM CAPSIM 2 Andrews CS8550 Round 1 - 2020 Proformas - Inquirer File - Unde Decisions - Human Resources - Help DRAFT SAVED AT UMMON Staffing Last Year This Year 804 804 100% 100% 804 804 552 279 252 0.0% 0.0% 10.0% 10.0% 140 "Labor Negotiations Current Contract Hourly Wage $25.53 Benefits $4,500 Profit Sharing % 2.0% Annual Raise 5.0% Labor Demands $ 28.08 $2,750 2.2% 5.5% Negotiation Postion Starting Celing $25.53 $28.08 2,500 $2,750 2.0% 2.296 5.0% 5.5% Contract Expiration: 1-Oct-2024 Needed Complement Complement % Complement ist Shift Complement 2nd Shift Complement Overtime% "Tumover Rate New Employees Separated Employees Recruiting Spend Training Hours Productivity Index Recruiting Cost Separation Cost Training Cost Total HR Admin Costs $0 $ 100.0% 100.0% $80 $80 Finance DRAFT SAVED AT Apr 29, 2020 11:24AM MOT Liabilities & Owner's Equity Common Stock Retained Earnings Long Term Debt 2,051 $ 95.50 $ 12.34 $ 39,174 Current Debt Accounts Payable Finances PLANT IMPROVEMENTS Total Investments (5000) Sales Of Plant & Equipment COMMON STOCK Shares Outstanding (000) Price Per Share Earnings Per Share Max Stock Issue (5000) "Issue Stock (5000) Max Stock Retire (5000) Retire Stock (5000) Dividend Per Share CURRENT DEBT interest Rate "Due This Year Borrow (5000) CASH POSITIONS December 31, 2019 December 31, 2020 $ 9,794 10.00 Long Term Debt Retre Long Term Debt (5000) Issue Long Term Debt (5000) Long Term Interest Rate Maximum Issue This Year 10.0% $ 16,717 A/R Lag (days) WP Lag (days) $ 31,800 41,481 Outstanding Bonds Senes Number Face Amount $0 13.552021 S 11.300 11.252026 S8837 11.952027 $7,072 Current Yield 13.0% 11.3% 11.6% 2019 Close $103.58 $99.07 102.54 TQM Initiative Other bookmarks BIUFT SAVEDRA. TO Projected Impact Budget ($000) Process Management Initiatives CPI Systems Vendor/JIT Quality Initiative Training Channel Support Systems Concurrent Engineering UNEP Green Programs Total Current Expenditures (5000): laskentella PROJECTED CUMULATIVE IMPACTS Material Cost Reduction Labor Cost Reduction Reduction R&D Cycle Time Reduction in Admin Costs Demand increase Worst Case Best Case 0.0% 0.0% 0.0% 0.0% 0.0% 0.0% 0.0% 0.0% 0.096 0.0% TQM INITIATIVES Benchmarking Quality Function Deployment Effort CCE/6 Sigma Training GEMI TQEM Sustainability Initiatives osteolantan Reduction in Cost of Gopdaterialu For the Year Just Ended Admin Cost Reductions For the Year Just Ended R&D Cycle Time Reductions For the Year Just Ended Demand Increase For the Year Just Ended Andrews Chester Dec 2013 OSOS Nexander Jones Jones Baldwin Andrews Darius Alexander Jonas Selected Financial Statistics Andrews 12.35 Digby 9.2% Chester 8.6% 0.94 8.15 24 19.2% 16.3% 11.8% 22.44 ROS Asset Turnover ROA Leverage (Assete Equity ROE Emergency Loan Sale EBIT Profita Cumulative Pront SG&A Sales Contrib. Margin% 28.3% 5163 405.682 $33 465 763 $20,139 267 5131.627447 $21,737.192 118 809 302 523.745 048 $10.189.632 $119.585.004 $21.00323 $11.056.951 10.34 333 Percent of Sales S Market Share Profit Other SGA Depr Var Costs $ 98 Andres 30 63% Baldwin 24.68% Chester 22275 Digby 22.42% Badwin Chester Digby Andrews COMP-XMO INQUIRER INOHIRE Close Company Andrews Change $15.09 50.90 S10 Stock Market Summary Shares 2.051 207 2565 559 2.500.550 S1 2.173.578 5 115 ca $44.6 S12 TOD stocks & Bonda INOUT Darius Alexander Jones December 31. 2018 Company Yold Close $95.50 $44.61 $53.12 $55.60 Change $15.09 $0.90 $10.94 57.00 Stock Market Summary Marketcap Shares BOOK Value Per Share 2051 207 $198 $34.70 2.588.559 $21.30 2,173,578 $115 $24.47 1.909 872 5108 $25.90 Dividend SASO $114 52.88 5579 Closing Stock Price Andrews Baldwin + Chester Digby 2015 2016 2017 2019 2020 2022 2018 12021 Bond Market Summary Company Series Face Mold Closes Andrews 13.552021 11292028 11.952027 $11.300,000 $8.837,000 57.072,000 130 11.35 11 103158 99.07 102.54 Baldwin 13.552021 11.392026 12 552027 12592028 12.592029 S11 300.000 $10 417 800 514.665,611 57.981720 $9473587 WWW 100.17 SO 9574 25.45 S619 888 00000 8888 Chester 100.83 13.552021 11 252026 AS2027 11.902029 $11.300.000 $8.639 846 55.628 300 $15.800.742 Digby 10250 13.552021 11.152028 1122029 $11,300.000 $2.500.000 5.575227 Next Year's Prime Rate 3.00% COMP. XV INQUIRER Financial Summary INOUIRER Cash Flow statement Survey Icash flows from operating activities Top INOVARER Darius Alexander Jones Andrew HOME $20,139 Round: December 31, 2019 Chester Digby $10,190 $11,057 $8.293 $5,625 Financial Summary Cash Flow Statement survey Cash flows from operating activities Net Income (Loss) Adjustment for non-cash items Depreciation Extraordinary gains losses writos Changes in current assets and liabilities Accounts payable Inventory Accounts receivable Net cash from operations $7,500 58.455 59,527 90 5735 (511.277) 520 516,072 $1.457 (52.688) ($1.038 $14.780 $800 $1,429 $954) 519,565 $997 $3181 ($1,778) $16.221 (53,520) ($13.333) ($1.995) (515.800) ($12.694) (526,642) (56.250) (56,500)| (54,465) Cash flows from Investing activities Plant improvements (net) cash flows from financing activities Dividends paid Sales of common stock Purchase of common stock Cash from long term debt issued Early retirement of long term debt Retirement of current dett Cars from current debt borrowing Cash from emergency loan SO SO $9.474 $15.601 (51,829) $5.675 50 50 SO (55,725 S8154 $22,170 $21,706 $15.864) $19.606 ($10.4833 $12.101 Net cash from financing activities $13.090 glu Not change in cash position Balance sheet Survey Ch Accounts Receivable Inventory Total Current Accet (512.809 5257) Andrews 531.800 $13.431 $25.972 571200 596824 (544.409) 552415 $123817 (53.685) 54.725) Baldwin $32.141 $10.319 $106.45 $53.405 5142.900 $51 265) 591835 $8.018 Chester $32523 $9.765 $8.447 $48738 $1,000 $10.721 Digby 519.743 59 829 $14812 $44.404 Plant and equipment Accumulated Depreciation Total Fixed Assets 5+24400 (547.289) S77.111 $8430 $35.023 $49,357 Total Assets $145.000 S125.847 593.781 Accounts Payable Current Debt Total Current Liabilities 57.263 $29.239 536 522 55796 525419 531285 56 382 $1842 $24.814 $9518 $1577 525230 527209 552.44 Long Term Debt Total Liabilities 541 369 $72455 $19.479/ 544293 $53.839 590.361 $24.084 $29.995 554.680 Common Stock Retained Earrings Total Couty $14119 S8800 553.192 559.094 571.175 5123.617 59.102 $40.367 549.468 593.761 Total Liabilities & Owners' Equity 5145040 5125 847 Andrews $ $107522 54574 96.455 512 Baldwin $131.527 557179 Su 39 527 52711 Income statement Survey Sales Variable Costs Labor. Material Carry) Contribution Margin Depreciation SGA (R&D Promo, Sales, Admin) Other (ees, Writeos, TOM Bonuses BIT Interest (Short term Lorgenm) Taxes Profit Sharing Chester 5148 309 572225 S48.000 S293 513285 5760 $275 5779 $5.599 5200 $10.190 Digoy $119 363 579.784 $99.841 55.825 512301 $311 521803 50205 58 075 52 737 5998 538 456 54 350 511 411 52 $150 511057 Page 3 COVP-XX INQUIRER Production Analysle INRUINER Darius Alexander Jones Round: December 31, 2019 Production vs Capacity Andrews Baldwin Chester Digby 1.000 1,500 2.000 4,000 4,500 6,000 6,500 2,600 Capacity 3,000 3,500 Production Production Information 2nd Auto Shift & mation Capacity aterial Labor Contr. Over Next Next Cost Marg. time Round Round Utiliz. 30% 759 714 1.130 1200 121% 188% 149% 1415 129 359 33% Unit Primary Units inven Plum Size M Segment Sold tory Revision Date Dec.31 MTBF Coard Coord Price de 217 11/14/2019 1.1 26000 12.7 9.6 542.00 Thri 1269 4/13/2017 5.1 20000 52 14.9 $28.00 Core 12/10/2018 22 22000 79 122 $32.00 NO 265 11/9/2019 11 24000 10.6 76 $40.00 Thri 1,339 12/11/2019 2017000 6.3 13.8 519.00 12/19/2019 2.8 17000 6.5 13.6 519.00 Core 1.288 150 12/3/2019 12 18000 09 10.8 $27.00 Core 1,415 11/19/2019 12 20000 9.6 113 $28.00 Their 1.728 8/27/2020 3.5 14000 5.5 146 $20.00 Core 13 11/30/2019 12 16000 8.1 120 522.00 Nano 299 12/22/2019 1.1 18000 10.0 8.3 $31.00 Clie 11/5/2019 1.1 20000 120 10.1 535.00 Nano 1.127 11/12/2019 22 23000 8.9 9.4 $30.00 lite 435 12/13 2019 19 25000 12.1 102 $38.00 Nano 12/22/2019 10 23000 10.5 76 537.00 12.5.2019 10 25000 12.5 96 539.00 132 155% 1915 1919 30% 304 $16.81 $9.80 58.13 $7.90 $11.60 $8.98 $16.13 $10.29 58.40 $4.03 $8.61 $4.22 $11.68 $7.38 1239 S738 $6.65 5282 $10,01 $5.64 $13.64 56.24 514 38 57.09 $13.90 $9.50 $15.67 7.73 $15.79 $8.50 $16.39 57.95 51% 38 1984 1905 124% 107 604 100 Dalt 570 25% 41% 34% 37% 00 1915 845 125 105% 50 Oino bome COMPXMO INQUIRER | Pago TOR Thrift Market segment Analysis TOR INQUIRER Darius Nexander Jones December 31, 2019 Accessibility Thrit Andrews Thrift Statistica Total Industry Unit Demand Actual Industry Unit Sales Segment of Total Industry SRR Baldwin 110% Next Year's Segment Growth Rate Thrift Customer Buying Criteria Expectos 1. Price $14.00 - 20.00 Reliability MTBF 14000 20000 Ideal Position Pimn 6.0 Sure 14.1 Age Ideal Age 30 Perceptual Map for Thrift Segment Perceptual tend 296 0% 20% 40% 80% 80% 100% Actual vs Potential Market Share 2019 Thrin Andrews Chester Digby Bald Actual Potential S Market Name Share Dec Cust Surve Bol Units Sold to Seg 1.402 1.185 1,039 340 518 23% 20% Revision Date 12/19 2019 121 2019 6/27/2020 4/13/2017 11/30/2019 12312019 11/19 2019 Top Products in Thrift Segment Dust Pim Sine List Age Promo Aware Coard Core Price TOT De Budg e s 85 136 519.00 17000 256 51.050 83% 63 138 $19.00 2002751105063 5.5 146 520.00 3.48 950 52% $26.00 0 5 .11 $1.200 79% 52200 000117 950 $27.00 0 121 $1.050 52% $28.00 25 1650 - Cust Sales Access Budset by 5800 2 51 000 2 $1,000 35 52.000 74% 51.000 03 $600 629 5800 10% 10% Bar Page 5 COMP-XMO INQUIRER Core Market Segment Analysis INOR Darius Alexander Jones Round December 31, 2019 Accessibility Core Andrews Baldwin Chester Core Statistics Total Industry Unit Demand Actual Industry Unit Sales B1879 Segment % of Total Industry 35.3% Next Year's Segment Growth Rate 10.0% Core Customer Buying Criteria Expectations Importance 1. Price $20.00 - 32.00 46% 2. Age Ideal Age = 2.0 3 Reliability MTBF 16000 22000 165 4. Ideal Position Pimn 8.1 Size 12.0 Perceptual Map for Coro segment Perceptual map (st end of this year Digby 0% 205 80% 16 Actual vs Potential Market Share 2019 Core Andrews Chester Digoy Actual Potential Top Products in Core Segment Survey Stock Out 2 35 1545 Market Sold to Revision Name Share Seg Date Call 20751388 11/30/2019 Ace 189 1.227 12.10.2018 Bolt 987 11/19 2019 15% 979 12/3 2019 Cat 10 699 6:27 2020 4/13/2017 Daft 4141122019 Bell 270 12/19 2019 Ban 154 12/11/2019 54 12:22 2019 11.5.2019 Cory COMP-XV INQUIRER Bill Sales Budget $1000 $1.000 S80 5000 $1.000 52 000 $400 $800 51.000 $800 50 Pm Size List Age Promo Are Coord Coord Price TBF Dee Duostess 3.1 120 522.00 16000 +17 $950 52 79 12253200 22000 224 $1200 113 $28.00 20000 125 51050 39 103 $27.00 18000 02 520.00 14000 366 950 149 52600 20000 5.11 $1.200 79 530.00 23000 29 $1.00 71 136 $19.00 17000 2 51 OS $19.00 276 1050 10083 53100 3000 $950 535 120101 $3500 20000 12 9505 500 62 35% 22 585 58% 6245 82 2000 2 City Hand Market segment Analysis INVER Darius Alexander Jones Round: December 31, 2019 Accessibility Nano Andrews 3,849 3.649 19 Baldwin 140 Chester Nano Statistica Total Industry Unit Demand Actual Industry Unit Sales Segment of Total Industry Next Year's Segment Growth Rate Nano Customer Buying Criteria Expectations Importance 1. Ideal Position Plm 10.0 Size 8.1 35% 12. Price $28.00 - 40.00 13. Age Ideal Age = 1.0 14. Reliability MTBF 18000 24000 Perceptual Map for Nano Segment Perceptual map at end of this year Digby 20% 405 60% Actual vs Potential Market Share 2019 Nano Andrews Baldwin Chester Digby I Actual Potential - Units Sold to Ced Stock Cust Survey Market Name Share Dino 1896 380 5600 136 12 Axe City Daft Ace Dome Bot Cory 630 164 431 298 260 Revision Dale 12/22/2019 11.9.2019 12/22/2019 11.12.2019 12.10.2018 12.5.2019 11/19 2019 11/52019 12/3/2019 11/1412019 12/13/2019 Top Products in Nano Segment Cust Pimn Size List Age Promo Aware Coord CoordPrice MTBT Dec 31 Bustess 105 76 537 00 23000 10 1.100 704 1076 76 $40.00 24000 1.12 $1.200 78% 100 93 53100 18000 108 $950 53% B9 94 53000 23000 2.19 $1.100 71% 79 122 $32.00 22000 2.24 51200 80% 125 9.6 $39.00 25000 105 $1,100 899 96 113 520.00 20000 125 $1.050 120 101 $35.00 20000 12 $950 52% 89101352700 18000 121 $1.050 824 127 8 4200 26000 1091200 275 1211012 0 25000 1.100 22 Cust Sales Access Duset $200 31 $1.000 824 DOS 5400 81% $1,000 $1.200 SA 51 300 66 5600 $1.000 829 S100315 Batt 59 236 183 161 Art 25 Page COD Y NOTTIRER Top INQUIRER Eitto Market segment Analysis Darius Alexander Jones Roundo December 31, 2019 Accessibility Elite Andrews Ente Statistics Total Industry Unit Demand Actual Industry Unit Sales Segment % of Total Industry 3.478 3,478 18.4% Baldwin Next Year's Segment Growth Rate 18.0% Chester Digby JE 1. 2. 3 24% Elite Customer Buying Criteria Expectations Importance Age Ideal Age=0.0 Price $30.00 - 42.00 Ideal Position Pn 120 Size 10.1 Rebity MTBF 20000-26000 Perceptual Map for Elite Segment Perpetual end of the 2096406 80% 100% Actual vs Potential Market Share 2019 Andrews Cheste Diopy Top Products in Elite Segment Units Goldto Revision Aware Sid Out 55 Market Name Share 10 Dome 175 Cary Deal Ace Dino IA 0 10 804 125.2010 361 115. 1 3:46 121122010 306 12/102016 30021222019 Di Sie 200 Promo CoordCoordPrice TOP 31 127 6 53200 20000 109 $1200 539.00 25000 105 S1 TO 53500 20000 125050 19151 100 79 122520022000 22 1 200 537.00 23000 $100 106 280 200 $1200 $3000 23000 2 1951 010 3 100 000 0 505 6 11 3 52000 2000025 150 393 2002 SEO ST $ 50 7999 282 11/12 2019 15212222019 101 11102019 51 122 2019 DER AD Payo Top Market Share Roport INOUIRER Darius Alexander Jones Round: 0 December 31, 2018 Units Sold vs Demand Chart Market Share 6,000 6,000 4,000 3,000 2,000 1,000 Andrews Baldwin Chester Digby Thrift Core Nano Elite Thrift Core O Nano O Elite Total Unit Demand Industry Unit Sales Total Potona MOTO Sharo in Unit Thrift Coro Nano Elite 5.102 6,679 3.649 3.478 18.908 hits Industry Unit Sales of Market Total 18,906 100.0% 100.0% pemanded of Market 27.0% 35.3% 19,3% 18.4% Actual Market share in unita Thrift Coro Nano Elite 5.102 6.679 3.649 3.478 27.0% 35.3% 19,3% 18.4% 4.4% 17.6% 16.5% 7.9% 18.4% 8.15 8.8% 17.3% 8.4% 16.5% 26.3% 29.8% 34.8% M 4.4% 17.6% Ant 16.3% 7.8% 7.2% 9.7% 4.9% 25.9% And noo xe Total 7.1 9.54 4.95 xe 8.195 17:36 29.8% 8.8% 8.4% 34.0% Total 16.3% 25.7% 25.0% rn Del 23.2% 27.5% 1.45 0.9% 53.1% am Bed 2.3% 40% 14.7% 14.8% 35,8% 5.0% 6,6% 11.6% 7.15 8.8% 68% 7.5% 30.2% 1.6% 40% 56% 23.0% 27 24 1.4% 0.9% 23% 40% 1439 14.45 35.0% 7.0% 8.7% 6.7% 7.49 29.8% Bolt 5.0% 6.6% 11.6% Polt Total 5.69 52.4% 50 20.4% 10.15 9.15 10.0% Lat 20.3% 11.0% 10.3% 20.5% 0.8% 0.15 31.7% 8.2% 12.79 6.5% 19.2% 5.2% 10.4% 15.6% 3.7% 3.2% 28.0% 10.2% 22.2% 0.3% 0.15 33 25 12.7% 8.5% 19.2% 52% 10.4% 15.6% 9.15 10.8% 3.7% 3.2% 28.8% Total 30.5% oual 31.35 6.15 paft ban 11.8% 2.5% 18.1% 7.15 39.5% 8.15 9.9% 86% 17.4% 44.15 6.0% 2.3% 5.1% 11.85 8.15 25% 9.995 18.1 .6 174 39.5% Dear Pino bome 5.9% 23 5.1 40 9 Pago Dino Dome 17.9" 8.2 6.04 COWP-XVO INQUIRER Tog Perceptual Map INOU E R Darius Alexander Jones Mendo Perceptual Map for All Segments Perceptual map (at end of this year) Size Dat 1 2 3 4 5 8 10 12 14 Performance 16 18 19 20 Baldwin porn size Name Chester Porn Site Revised NATO 11/14 2019 Bar 4/13 2017 Bell 12/102018 11912019 alt 138 Revised Name 12/11 2019 12/19 2019 Ice 12120 19 Ly 119 2019 120 3.1 90 120 Revised 6/27/2020 11/30/2019 12.02.2019 19.5.2019 Andrews Pimn Size 127 98 5.2 14.9 79122 106 78 Digoy Pin Size 94 12.1 102 105 78 12.5 INAMO Revised 11/12.2019 12.13.2019 12.22.2019 125 2019 COMP.XVO INQUIRER INQUIRER Darius Alexander Jones Round December 31, 2019 HUMAN RESOURCES SUMMARY Andrews Chest Digby Needed Complement Complement 1st Shi Complement 2nd Shirt Complement 0.0% 100% 0.0% 10.0% 180 Overtime Tumover Rate New Employees Separated Employees Recruiting Spend Training Hours Productivity Index $2.500 55.000 100.0% 108. 117.6% 1000 5140 5390 $324 Recruiting Cost Separation Cost Training Cost Total HR Admin Cost SO SO $637 $140 S691 5621 Labor Contract Next Year Wages Benefits Profit Sharing Annual Raise 525 53 2.500 525.53 2.500 20% 5.0% 525.53 2.500 205 50% 525.53 2.500 20% 50% Starting Negotiation Position Wages Benes Profit Sharing Annual Raise Calling Negotiation Position Benetes Profit Sharing Annual Raise Adjusted Labor Demande Wages Benefits Profit Sharing Annual Raise Sebas TQM SUMMARY Andrews Process Mgt Budgets Last Year CP Systems Nondon IT Quality Initiative Training Channel Susport Systems Concurrent Engineering UNEP Green Programs TOM Budgets Last Year 888888888 SSSSSSSSS 838888 888 Quality Function Deployment for borsar Traning Annual Report And Balance Sheet 2015 Common $31.000 513431 $25.972 25.7% 10 9 21.0% $32.057 $13.451 514.896 571-203 57.6% 560.203 SOB 24 (544,409) 783% 35 $93304 (537.954) $52.415 555350 BRUSCommon in the common ASSETS size column simply represents each items percentage of total assets for that you. Cash: Your end of year cash position. Accounts Cash Receivable Reflects the leg between divery Account Recto and payment of your products Inventones: The Inventory burrent value of your inventory across all products. Azero indicates your company stocked Total Current Assets but Unimet demand wou, of course to your competitors. Plant & Equipment. The current Plant & Equipment value of your plant. Accur Deprec: The total Accumulated Depreciation accumulated depreciation from your plant. Accts Payable What the company currently owes Total Fixed Assets suppliers for materials and services. Current Debt. The debt the company is obligated to pay during the next year of operations, includes emergency loans used to keep your company ARUTES & OWNERS halvent should you run out of cash during the EQUITY year. Long Term Debt. The company's long term debat is in the form of bonds, and this represents ecounts Payable The total value of your bonds. Common Stock Current De The amount of capital invested by shareholders Tong Term Dat In the company Retained Earnings. The profis that the company chose to keep instead of paying to shareholders as dividends. Total abilities Common Stock Retained Earnings $123617 100.0% $115,552 $9.516 515 717 527209 7.74 12.74 220 S8781 55.725 3072 552.462 $1200 549.240 $12.443 553 360 $S9 094 47 % 571.174 57.6% Total Equity Total Lab. &0. Equity $123.617 100.0% $115.552 Cash Flow Statement 2018 520.139 56.455 52 511 56.220 5735 (511 277) 52083 53.996 52 99 $23.222 51.620 une com e cash caniowe from operating Activ Account during the year Casinction assive numbers and Netcome Los) sash withdrawals as negative numbers. The Carshow Statement Depreciation excellent tool for diagnosing emergency loans. When negative cash flows Extraordinary gais ses will cod positives you are forced to seek emergency funding for Accounts Payable example s are bad and you find your carrying an abundance of Inventory excessiven the report would show the increase in invertory huge negative cash Bow Too much unexpected inventory could out Accounts Recevable your infows, exhaust your starting cash and force you to be for money Net cash from operations o keep your company afloat. Cash Flows from Investing Activities Plantrovements Cash Flow Summary Cash Flows from Financing Activities: Dividende Andreas Sales of Common Stock Purchase of Common Stock 15.000 Cash from long tomm debl. 10.000 Retirement of longe det 6.000 Change in current de net) Not carsh from financing activites Not change in cash position -5,000 Closing cash position -10.000 Operations Finance Chg Cash Operations Investment Finance 516,072 (53.520) $13.333) 50 (51.935) SO 57 533 59912 5541 SO 52.070 (512.809) 510.559 5257) 510,845 531 800 532.057 Annual Report Andrews 2019 Income Statement (Pro ) And OS BE 52424 S. 336.62 1 000 Variable Coate wewe $7,017 $12.50 16.00 2 AM 156 27 $10,015 $11.567 51/4 0.425 $14.350 SSSSSS entory Car Total Veratie 520.157 53313 524 602 ST 511,766 20212 512,250 574 3419 Period Coat Depreciation SORA RAD 52.200 52.000 51.000 3070 Promo 51.200 2000 280 35 740 $1200 $1.200 $1.000 $1.000 O $200 5470054427 SSSSSS Sales Admin Period 888888 $1.254 51920 Met Margin 56.015 $15.472 7.824 2235 0 219 U m er bor boss incurred to produce the broduct that was inventory Carry Cost theo r y unsod pods in inventory Depreciation Calculadora line 15 yedepreciation of plant value RD Costa RED department expenditures for product Admin on overhead is estimated 15% of Promotions. The promotion budget for each product Sales: The sales foron budget for nach product other Charges not included in other c aries such as Fees, Write Offs, and from. The fees include money paid to investmentbarkers and brokerage firms to issue new od or bonds plus consulting for your instructor might s . Write-offs include the loss you might experience when you se pocity or liquidate inventory as the result of eliminating a production in the mountappens negative amount, then you actually made money on the liquidation of capacity invory. EBIT Caming Before Interest and Taxes Short Term Interest interest expense based on last year's current debt, including short form debil, long form holes that have become du gency for Long Term Interest interest paid on outstanding bonds Tax Income tax based upon a 35% tax rate. Profit Sharing Profits shared with employees under the labor contre, Net Pront CBT minus interests and profit 596 Shorts $1.0 Long Term interest 53357 ST Pro Sharing 5411 Net Profit 520,139 Variable Margins 2008 Andres 0.3% 12,3% 30.0% 200% 100% DON E332 2 2 2 Profit History Market Share History $20,000 $15.000 $10.000 $5,000 2018 2019 2015 2016 2017 2018 2019 ROE History Asset Turnover History 888 536.495 22 Total Period 1303 5,740 54.740 AM Net Margin 37,164 $8,015 $15.472 7.224 50 Definitions Un l imes List price. Direct Labor Labor costs incurred to produce the product that was sold Inventory Carny cost the cost o carry unsold goods in inventory Depreciation: Calculated on straight-line 15-year depreciation of plant value R&D Costa RAD department expenditures for each product Admin Administration overhead is c ated at 1.5% of sales. Promotions: The promotion budget for each product Sales: The salesforce budget for rach product Other: Charges not included in other categories such as Fees, W e Ofsand TOM The fees include money paid to investment bankers and brokerage firms to issue new sodes or bonds plus consulting fees your instructor might assess. Write-offs include the loss you might experience when you sel capacity or liquidate inventory as the result of liminating a production line. If the amount appears as a negative amount, then you actually made money on the liquidation of capacity or inventory. EBIT: Earnings Before Interest and Taxes Short Term Interest Interest expense based on last year's current debt, including short term debt, long term notes that have become due, and emergency loans. Long Term Interest Interest pas outstanding bonds. Tree: Income tax based upon a 35% tax rate. Pront Sharting Profissha with employees under the labor contract. Not Pront EBIT minus interest, taxes, and profit sharing. $29 536 46 Short Term Interest $1.490 Long Term Interest $3357 $11.006 Pe Sharing 5411 Net Profit 520,139 Variable Margins 2008 Andrews 0.0% 22.3% 0.9% 2.1% 8.895 0.3 12.3% 00% 592 2 2 2 Profit History Market Share History $20,000 $15.000 $10,000 55,000 2015 2016 2017 2018 2019 2016 2017 2018 2019 ROE History Asset Turnover History 2015 2018 2019 2015 2016 2017 2018 2019 2016 2017 ROS History ROA History 8 2016 2017 2018 2019 2015 2016 2017 2018 2015 Annual Report 2019 Page 2 Research & Development DRAFT SAVED AT Apr 11, 2020 10 CAM MOT Perceptual map ( end of this year) Decisions Name New Pfmn New Size MTBF Revision Date Age at Revision R&D Cost (5000) Art Ant Ace Axe 12.7 5.2 7.9 9.6 14.9 12.2 26000 20000 22000 24000 7.6 Na 0.0 Na 0 Total Age Profiles Material Cost in Years rceived Marketing DRAFT SAVED AT Apr 21, 2020 11:23AM MOT Marketing Decisions Name Price Promo Sales Budget Budget Benchmark Prediction "Your GEOSS Sales Forecast "Variable Costs Contrib Margin Forecast "Less Promo & Sales $ Ant Ace Axe 42.00 $ 26.00 $ 32.00$ 40.00 $ 1200 $ 1200 $ 1200 $ 1200 $ $0 $0 1000 2000 1000 1000 1,486 769 1,957 2,0451 Revenue Forecast Costs $ 62,396 $ 19,981 $ 62,637 $81.781 $0 $ $ $ $0.0 $0.0 $0.0 $0.0 $ 38,100 $ 10,973 $ 37,953 $ 52.731 $ 24,296 $ 9,008 $ 24,684 $ 29,050 $22,096 $ 5,808 $ 22,484 $ 26,850 NA $o NA $0 0 $0 $0 $0 $0 NA NA Total $0 $0 $0 $ 5,000 So $0 $4,800 $0 $0 6,256 0 $ 226,795 $ 139,757 $0 $ 87,038 $77,238 Note: The Benchmark Prediction estimates unit sales assuming your product competes with a standardized, mediocre playing field. It does not use your actual competitors products. It is useful for experimenting with price, promo and sales budgets. It is usulace for forecasting A/R Lag (days) "A/P Lag (days) Unit Sales Forecast Revenue Forecast 580,000 570.000 500.000 550.000 $40.000 $30,000 $20,000 510,000 Production DRAFT SAVED AT Apr 21, 2020 1.2M MOT Ace Axe NA NA NA Art 1.486 217 750 743 Ant 769 759 2150 2,129 1.957 51 1800 2,045 265 950 Total 6,256 1,292 5,650 5.595 1,782 941 0.0% $0.00 SCHEDULE Unit Sales Forecast Inventory On Hand Production Schedule Production After Adj. MARGINS 2nd Shift Production% Labor Cost/Unit Material Cost/Unit Total Unit Cost Contribution Margin PHYSICAL PLANT 1st Shift Capacity Buy/Sell Capacity Automation Rating New Autom. Rating Investment (5000) WORKFORCE Complement 5.19 $9.67 $15.98 $25.65 38.99 90.396 $8.28 $6.00 $14.28 45.196 50.096 $9.39 $10.00 $19.39 39.496 30.5% $10.50 $15.29 $25.79 35.5% 0.096 $0.00 $0.00 $0.00 0.0% 0.0% $0.00 $0.00 $0.00 0.096 $0.00 $0.00 0.046 $0.00 $0.00 $0.00 0.0% 0.096 714 1.130 1,200 728 Total 3,772 0 6.0 4.0 6.0 5.0 5.0 4.0 $0 $ ast Year 804 $0 "Needed 804 'ist Shift "This Year 100 This Year 804 $0 Overtime Max Invest 0.0% AP Lag 2nd Shift 252 $0 $ 59,574 552 30 Production Vs. Capacity Both Shirts Base Capacity Price Ve Unit Cost WEBM CAPSIM 2 Andrews CS8550 Round 1 - 2020 Proformas - Inquirer File - Unde Decisions - Human Resources - Help DRAFT SAVED AT UMMON Staffing Last Year This Year 804 804 100% 100% 804 804 552 279 252 0.0% 0.0% 10.0% 10.0% 140 "Labor Negotiations Current Contract Hourly Wage $25.53 Benefits $4,500 Profit Sharing % 2.0% Annual Raise 5.0% Labor Demands $ 28.08 $2,750 2.2% 5.5% Negotiation Postion Starting Celing $25.53 $28.08 2,500 $2,750 2.0% 2.296 5.0% 5.5% Contract Expiration: 1-Oct-2024 Needed Complement Complement % Complement ist Shift Complement 2nd Shift Complement Overtime% "Tumover Rate New Employees Separated Employees Recruiting Spend Training Hours Productivity Index Recruiting Cost Separation Cost Training Cost Total HR Admin Costs $0 $ 100.0% 100.0% $80 $80 Finance DRAFT SAVED AT Apr 29, 2020 11:24AM MOT Liabilities & Owner's Equity Common Stock Retained Earnings Long Term Debt 2,051 $ 95.50 $ 12.34 $ 39,174 Current Debt Accounts Payable Finances PLANT IMPROVEMENTS Total Investments (5000) Sales Of Plant & Equipment COMMON STOCK Shares Outstanding (000) Price Per Share Earnings Per Share Max Stock Issue (5000) "Issue Stock (5000) Max Stock Retire (5000) Retire Stock (5000) Dividend Per Share CURRENT DEBT interest Rate "Due This Year Borrow (5000) CASH POSITIONS December 31, 2019 December 31, 2020 $ 9,794 10.00 Long Term Debt Retre Long Term Debt (5000) Issue Long Term Debt (5000) Long Term Interest Rate Maximum Issue This Year 10.0% $ 16,717 A/R Lag (days) WP Lag (days) $ 31,800 41,481 Outstanding Bonds Senes Number Face Amount $0 13.552021 S 11.300 11.252026 S8837 11.952027 $7,072 Current Yield 13.0% 11.3% 11.6% 2019 Close $103.58 $99.07 102.54 TQM Initiative Other bookmarks BIUFT SAVEDRA. TO Projected Impact Budget ($000) Process Management Initiatives CPI Systems Vendor/JIT Quality Initiative Training Channel Support Systems Concurrent Engineering UNEP Green Programs Total Current Expenditures (5000): laskentella PROJECTED CUMULATIVE IMPACTS Material Cost Reduction Labor Cost Reduction Reduction R&D Cycle Time Reduction in Admin Costs Demand increase Worst Case Best Case 0.0% 0.0% 0.0% 0.0% 0.0% 0.0% 0.0% 0.0% 0.096 0.0% TQM INITIATIVES Benchmarking Quality Function Deployment Effort CCE/6 Sigma Training GEMI TQEM Sustainability Initiatives osteolantan Reduction in Cost of Gopdaterialu For the Year Just Ended Admin Cost Reductions For the Year Just Ended R&D Cycle Time Reductions For the Year Just Ended Demand Increase For the Year Just Ended Andrews Chester Dec 2013 OSOS Nexander Jones Jones Baldwin Andrews Darius Alexander Jonas Selected Financial Statistics Andrews 12.35 Digby 9.2% Chester 8.6% 0.94 8.15 24 19.2% 16.3% 11.8% 22.44 ROS Asset Turnover ROA Leverage (Assete Equity ROE Emergency Loan Sale EBIT Profita Cumulative Pront SG&A Sales Contrib. Margin% 28.3% 5163 405.682 $33 465 763 $20,139 267 5131.627447 $21,737.192 118 809 302 523.745 048 $10.189.632 $119.585.004 $21.00323 $11.056.951 10.34 333 Percent of Sales S Market Share Profit Other SGA Depr Var Costs $ 98 Andres 30 63% Baldwin 24.68% Chester 22275 Digby 22.42% Badwin Chester Digby Andrews COMP-XMO INQUIRER INOHIRE Close Company Andrews Change $15.09 50.90 S10 Stock Market Summary Shares 2.051 207 2565 559 2.500.550 S1 2.173.578 5 115 ca $44.6 S12 TOD stocks & Bonda INOUT Darius Alexander Jones December 31. 2018 Company Yold Close $95.50 $44.61 $53.12 $55.60 Change $15.09 $0.90 $10.94 57.00 Stock Market Summary Marketcap Shares BOOK Value Per Share 2051 207 $198 $34.70 2.588.559 $21.30 2,173,578 $115 $24.47 1.909 872 5108 $25.90 Dividend SASO $114 52.88 5579 Closing Stock Price Andrews Baldwin + Chester Digby 2015 2016 2017 2019 2020 2022 2018 12021 Bond Market Summary Company Series Face Mold Closes Andrews 13.552021 11292028 11.952027 $11.300,000 $8.837,000 57.072,000 130 11.35 11 103158 99.07 102.54 Baldwin 13.552021 11.392026 12 552027 12592028 12.592029 S11 300.000 $10 417 800 514.665,611 57.981720 $9473587 WWW 100.17 SO 9574 25.45 S619 888 00000 8888 Chester 100.83 13.552021 11 252026 AS2027 11.902029 $11.300.000 $8.639 846 55.628 300 $15.800.742 Digby 10250 13.552021 11.152028 1122029 $11,300.000 $2.500.000 5.575227 Next Year's Prime Rate 3.00% COMP. XV INQUIRER Financial Summary INOUIRER Cash Flow statement Survey Icash flows from operating activities Top INOVARER Darius Alexander Jones Andrew HOME $20,139 Round: December 31, 2019 Chester Digby $10,190 $11,057 $8.293 $5,625 Financial Summary Cash Flow Statement survey Cash flows from operating activities Net Income (Loss) Adjustment for non-cash items Depreciation Extraordinary gains losses writos Changes in current assets and liabilities Accounts payable Inventory Accounts receivable Net cash from operations $7,500 58.455 59,527 90 5735 (511.277) 520 516,072 $1.457 (52.688) ($1.038 $14.780 $800 $1,429 $954) 519,565 $997 $3181 ($1,778) $16.221 (53,520) ($13.333) ($1.995) (515.800) ($12.694) (526,642) (56.250) (56,500)| (54,465) Cash flows from Investing activities Plant improvements (net) cash flows from financing activities Dividends paid Sales of common stock Purchase of common stock Cash from long term debt issued Early retirement of long term debt Retirement of current dett Cars from current debt borrowing Cash from emergency loan SO SO $9.474 $15.601 (51,829) $5.675 50 50 SO (55,725 S8154 $22,170 $21,706 $15.864) $19.606 ($10.4833 $12.101 Net cash from financing activities $13.090 glu Not change in cash position Balance sheet Survey Ch Accounts Receivable Inventory Total Current Accet (512.809 5257) Andrews 531.800 $13.431 $25.972 571200 596824 (544.409) 552415 $123817 (53.685) 54.725) Baldwin $32.141 $10.319 $106.45 $53.405 5142.900 $51 265) 591835 $8.018 Chester $32523 $9.765 $8.447 $48738 $1,000 $10.721 Digby 519.743 59 829 $14812 $44.404 Plant and equipment Accumulated Depreciation Total Fixed Assets 5+24400 (547.289) S77.111 $8430 $35.023 $49,357 Total Assets $145.000 S125.847 593.781 Accounts Payable Current Debt Total Current Liabilities 57.263 $29.239 536 522 55796 525419 531285 56 382 $1842 $24.814 $9518 $1577 525230 527209 552.44 Long Term Debt Total Liabilities 541 369 $72455 $19.479/ 544293 $53.839 590.361 $24.084 $29.995 554.680 Common Stock Retained Earrings Total Couty $14119 S8800 553.192 559.094 571.175 5123.617 59.102 $40.367 549.468 593.761 Total Liabilities & Owners' Equity 5145040 5125 847 Andrews $ $107522 54574 96.455 512 Baldwin $131.527 557179 Su 39 527 52711 Income statement Survey Sales Variable Costs Labor. Material Carry) Contribution Margin Depreciation SGA (R&D Promo, Sales, Admin) Other (ees, Writeos, TOM Bonuses BIT Interest (Short term Lorgenm) Taxes Profit Sharing Chester 5148 309 572225 S48.000 S293 513285 5760 $275 5779 $5.599 5200 $10.190 Digoy $119 363 579.784 $99.841 55.825 512301 $311 521803 50205 58 075 52 737 5998 538 456 54 350 511 411 52 $150 511057 Page 3 COVP-XX INQUIRER Production Analysle INRUINER Darius Alexander Jones Round: December 31, 2019 Production vs Capacity Andrews Baldwin Chester Digby 1.000 1,500 2.000 4,000 4,500 6,000 6,500 2,600 Capacity 3,000 3,500 Production Production Information 2nd Auto Shift & mation Capacity aterial Labor Contr. Over Next Next Cost Marg. time Round Round Utiliz. 30% 759 714 1.130 1200 121% 188% 149% 1415 129 359 33% Unit Primary Units inven Plum Size M Segment Sold tory Revision Date Dec.31 MTBF Coard Coord Price de 217 11/14/2019 1.1 26000 12.7 9.6 542.00 Thri 1269 4/13/2017 5.1 20000 52 14.9 $28.00 Core 12/10/2018 22 22000 79 122 $32.00 NO 265 11/9/2019 11 24000 10.6 76 $40.00 Thri 1,339 12/11/2019 2017000 6.3 13.8 519.00 12/19/2019 2.8 17000 6.5 13.6 519.00 Core 1.288 150 12/3/2019 12 18000 09 10.8 $27.00 Core 1,415 11/19/2019 12 20000 9.6 113 $28.00 Their 1.728 8/27/2020 3.5 14000 5.5 146 $20.00 Core 13 11/30/2019 12 16000 8.1 120 522.00 Nano 299 12/22/2019 1.1 18000 10.0 8.3 $31.00 Clie 11/5/2019 1.1 20000 120 10.1 535.00 Nano 1.127 11/12/2019 22 23000 8.9 9.4 $30.00 lite 435 12/13 2019 19 25000 12.1 102 $38.00 Nano 12/22/2019 10 23000 10.5 76 537.00 12.5.2019 10 25000 12.5 96 539.00 132 155% 1915 1919 30% 304 $16.81 $9.80 58.13 $7.90 $11.60 $8.98 $16.13 $10.29 58.40 $4.03 $8.61 $4.22 $11.68 $7.38 1239 S738 $6.65 5282 $10,01 $5.64 $13.64 56.24 514 38 57.09 $13.90 $9.50 $15.67 7.73 $15.79 $8.50 $16.39 57.95 51% 38 1984 1905 124% 107 604 100 Dalt 570 25% 41% 34% 37% 00 1915 845 125 105% 50 Oino bome COMPXMO INQUIRER | Pago TOR Thrift Market segment Analysis TOR INQUIRER Darius Nexander Jones December 31, 2019 Accessibility Thrit Andrews Thrift Statistica Total Industry Unit Demand Actual Industry Unit Sales Segment of Total Industry SRR Baldwin 110% Next Year's Segment Growth Rate Thrift Customer Buying Criteria Expectos 1. Price $14.00 - 20.00 Reliability MTBF 14000 20000 Ideal Position Pimn 6.0 Sure 14.1 Age Ideal Age 30 Perceptual Map for Thrift Segment Perceptual tend 296 0% 20% 40% 80% 80% 100% Actual vs Potential Market Share 2019 Thrin Andrews Chester Digby Bald Actual Potential S Market Name Share Dec Cust Surve Bol Units Sold to Seg 1.402 1.185 1,039 340 518 23% 20% Revision Date 12/19 2019 121 2019 6/27/2020 4/13/2017 11/30/2019 12312019 11/19 2019 Top Products in Thrift Segment Dust Pim Sine List Age Promo Aware Coard Core Price TOT De Budg e s 85 136 519.00 17000 256 51.050 83% 63 138 $19.00 2002751105063 5.5 146 520.00 3.48 950 52% $26.00 0 5 .11 $1.200 79% 52200 000117 950 $27.00 0 121 $1.050 52% $28.00 25 1650 - Cust Sales Access Budset by 5800 2 51 000 2 $1,000 35 52.000 74% 51.000 03 $600 629 5800 10% 10% Bar Page 5 COMP-XMO INQUIRER Core Market Segment Analysis INOR Darius Alexander Jones Round December 31, 2019 Accessibility Core Andrews Baldwin Chester Core Statistics Total Industry Unit Demand Actual Industry Unit Sales B1879 Segment % of Total Industry 35.3% Next Year's Segment Growth Rate 10.0% Core Customer Buying Criteria Expectations Importance 1. Price $20.00 - 32.00 46% 2. Age Ideal Age = 2.0 3 Reliability MTBF 16000 22000 165 4. Ideal Position Pimn 8.1 Size 12.0 Perceptual Map for Coro segment Perceptual map (st end of this year Digby 0% 205 80% 16 Actual vs Potential Market Share 2019 Core Andrews Chester Digoy Actual Potential Top Products in Core Segment Survey Stock Out 2 35 1545 Market Sold to Revision Name Share Seg Date Call 20751388 11/30/2019 Ace 189 1.227 12.10.2018 Bolt 987 11/19 2019 15% 979 12/3 2019 Cat 10 699 6:27 2020 4/13/2017 Daft 4141122019 Bell 270 12/19 2019 Ban 154 12/11/2019 54 12:22 2019 11.5.2019 Cory COMP-XV INQUIRER Bill Sales Budget $1000 $1.000 S80 5000 $1.000 52 000 $400 $800 51.000 $800 50 Pm Size List Age Promo Are Coord Coord Price TBF Dee Duostess 3.1 120 522.00 16000 +17 $950 52 79 12253200 22000 224 $1200 113 $28.00 20000 125 51050 39 103 $27.00 18000 02 520.00 14000 366 950 149 52600 20000 5.11 $1.200 79 530.00 23000 29 $1.00 71 136 $19.00 17000 2 51 OS $19.00 276 1050 10083 53100 3000 $950 535 120101 $3500 20000 12 9505 500 62 35% 22 585 58% 6245 82 2000 2 City Hand Market segment Analysis INVER Darius Alexander Jones Round: December 31, 2019 Accessibility Nano Andrews 3,849 3.649 19 Baldwin 140 Chester Nano Statistica Total Industry Unit Demand Actual Industry Unit Sales Segment of Total Industry Next Year's Segment Growth Rate Nano Customer Buying Criteria Expectations Importance 1. Ideal Position Plm 10.0 Size 8.1 35% 12. Price $28.00 - 40.00 13. Age Ideal Age = 1.0 14. Reliability MTBF 18000 24000 Perceptual Map for Nano Segment Perceptual map at end of this year Digby 20% 405 60% Actual vs Potential Market Share 2019 Nano Andrews Baldwin Chester Digby I Actual Potential - Units Sold to Ced Stock Cust Survey Market Name Share Dino 1896 380 5600 136 12 Axe City Daft Ace Dome Bot Cory 630 164 431 298 260 Revision Dale 12/22/2019 11.9.2019 12/22/2019 11.12.2019 12.10.2018 12.5.2019 11/19 2019 11/52019 12/3/2019 11/1412019 12/13/2019 Top Products in Nano Segment Cust Pimn Size List Age Promo Aware Coord CoordPrice MTBT Dec 31 Bustess 105 76 537 00 23000 10 1.100 704 1076 76 $40.00 24000 1.12 $1.200 78% 100 93 53100 18000 108 $950 53% B9 94 53000 23000 2.19 $1.100 71% 79 122 $32.00 22000 2.24 51200 80% 125 9.6 $39.00 25000 105 $1,100 899 96 113 520.00 20000 125 $1.050 120 101 $35.00 20000 12 $950 52% 89101352700 18000 121 $1.050 824 127 8 4200 26000 1091200 275 1211012 0 25000 1.100 22 Cust Sales Access Duset $200 31 $1.000 824 DOS 5400 81% $1,000 $1.200 SA 51 300 66 5600 $1.000 829 S100315 Batt 59 236 183 161 Art 25 Page COD Y NOTTIRER Top INQUIRER Eitto Market segment Analysis Darius Alexander Jones Roundo December 31, 2019 Accessibility Elite Andrews Ente Statistics Total Industry Unit Demand Actual Industry Unit Sales Segment % of Total Industry 3.478 3,478 18.4% Baldwin Next Year's Segment Growth Rate 18.0% Chester Digby JE 1. 2. 3 24% Elite Customer Buying Criteria Expectations Importance Age Ideal Age=0.0 Price $30.00 - 42.00 Ideal Position Pn 120 Size 10.1 Rebity MTBF 20000-26000 Perceptual Map for Elite Segment Perpetual end of the 2096406 80% 100% Actual vs Potential Market Share 2019 Andrews Cheste Diopy Top Products in Elite Segment Units Goldto Revision Aware Sid Out 55 Market Name Share 10 Dome 175 Cary Deal Ace Dino IA 0 10 804 125.2010 361 115. 1 3:46 121122010 306 12/102016 30021222019 Di Sie 200 Promo CoordCoordPrice TOP 31 127 6 53200 20000 109 $1200 539.00 25000 105 S1 TO 53500 20000 125050 19151 100 79 122520022000 22 1 200 537.00 23000 $100 106 280 200 $1200 $3000 23000 2 1951 010 3 100 000 0 505 6 11 3 52000 2000025 150 393 2002 SEO ST $ 50 7999 282 11/12 2019 15212222019 101 11102019 51 122 2019 DER AD Payo Top Market Share Roport INOUIRER Darius Alexander Jones Round: 0 December 31, 2018 Units Sold vs Demand Chart Market Share 6,000 6,000 4,000 3,000 2,000 1,000 Andrews Baldwin Chester Digby Thrift Core Nano Elite Thrift Core O Nano O Elite Total Unit Demand Industry Unit Sales Total Potona MOTO Sharo in Unit Thrift Coro Nano Elite 5.102 6,679 3.649 3.478 18.908 hits Industry Unit Sales of Market Total 18,906 100.0% 100.0% pemanded of Market 27.0% 35.3% 19,3% 18.4% Actual Market share in unita Thrift Coro Nano Elite 5.102 6.679 3.649 3.478 27.0% 35.3% 19,3% 18.4% 4.4% 17.6% 16.5% 7.9% 18.4% 8.15 8.8% 17.3% 8.4% 16.5% 26.3% 29.8% 34.8% M 4.4% 17.6% Ant 16.3% 7.8% 7.2% 9.7% 4.9% 25.9% And noo xe Total 7.1 9.54 4.95 xe 8.195 17:36 29.8% 8.8% 8.4% 34.0% Total 16.3% 25.7% 25.0% rn Del 23.2% 27.5% 1.45 0.9% 53.1% am Bed 2.3% 40% 14.7% 14.8% 35,8% 5.0% 6,6% 11.6% 7.15 8.8% 68% 7.5% 30.2% 1.6% 40% 56% 23.0% 27 24 1.4% 0.9% 23% 40% 1439 14.45 35.0% 7.0% 8.7% 6.7% 7.49 29.8% Bolt 5.0% 6.6% 11.6% Polt Total 5.69 52.4% 50 20.4% 10.15 9.15 10.0% Lat 20.3% 11.0% 10.3% 20.5% 0.8% 0.15 31.7% 8.2% 12.79 6.5% 19.2% 5.2% 10.4% 15.6% 3.7% 3.2% 28.0% 10.2% 22.2% 0.3% 0.15 33 25 12.7% 8.5% 19.2% 52% 10.4% 15.6% 9.15 10.8% 3.7% 3.2% 28.8% Total 30.5% oual 31.35 6.15 paft ban 11.8% 2.5% 18.1% 7.15 39.5% 8.15 9.9% 86% 17.4% 44.15 6.0% 2.3% 5.1% 11.85 8.15 25% 9.995 18.1 .6 174 39.5% Dear Pino bome 5.9% 23 5.1 40 9 Pago Dino Dome 17.9" 8.2 6.04 COWP-XVO INQUIRER Tog Perceptual Map INOU E R Darius Alexander Jones Mendo Perceptual Map for All Segments Perceptual map (at end of this year) Size Dat 1 2 3 4 5 8 10 12 14 Performance 16 18 19 20 Baldwin porn size Name Chester Porn Site Revised NATO 11/14 2019 Bar 4/13 2017 Bell 12/102018 11912019 alt 138 Revised Name 12/11 2019 12/19 2019 Ice 12120 19 Ly 119 2019 120 3.1 90 120 Revised 6/27/2020 11/30/2019 12.02.2019 19.5.2019 Andrews Pimn Size 127 98 5.2 14.9 79122 106 78 Digoy Pin Size 94 12.1 102 105 78 12.5 INAMO Revised 11/12.2019 12.13.2019 12.22.2019 125 2019 COMP.XVO INQUIRER INQUIRER Darius Alexander Jones Round December 31, 2019 HUMAN RESOURCES SUMMARY Andrews Chest Digby Needed Complement Complement 1st Shi Complement 2nd Shirt Complement 0.0% 100% 0.0% 10.0% 180 Overtime Tumover Rate New Employees Separated Employees Recruiting Spend Training Hours Productivity Index $2.500 55.000 100.0% 108. 117.6% 1000 5140 5390 $324 Recruiting Cost Separation Cost Training Cost Total HR Admin Cost SO SO $637 $140 S691 5621 Labor Contract Next Year Wages Benefits Profit Sharing Annual Raise 525 53 2.500 525.53 2.500 20% 5.0% 525.53 2.500 205 50% 525.53 2.500 20% 50% Starting Negotiation Position Wages Benes Profit Sharing Annual Raise Calling Negotiation Position Benetes Profit Sharing Annual Raise Adjusted Labor Demande Wages Benefits Profit Sharing Annual Raise Sebas TQM SUMMARY Andrews Process Mgt Budgets Last Year CP Systems Nondon IT Quality Initiative Training Channel Susport Systems Concurrent Engineering UNEP Green Programs TOM Budgets Last Year 888888888 SSSSSSSSS 838888 888 Quality Function Deployment for borsar Traning Annual Report And Balance Sheet 2015 Common $31.000 513431 $25.972 25.7% 10 9 21.0% $32.057 $13.451 514.896 571-203 57.6% 560.203 SOB 24 (544,409) 783% 35 $93304 (537.954) $52.415 555350 BRUSCommon in the common ASSETS size column simply represents each items percentage of total assets for that you. Cash: Your end of year cash position. Accounts Cash Receivable Reflects the leg between divery Account Recto and payment of your products Inventones: The Inventory burrent value of your inventory across all products. Azero indicates your company stocked Total Current Assets but Unimet demand wou, of course to your competitors. Plant & Equipment. The current Plant & Equipment value of your plant. Accur Deprec: The total Accumulated Depreciation accumulated depreciation from your plant. Accts Payable What the company currently owes Total Fixed Assets suppliers for materials and services. Current Debt. The debt the company is obligated to pay during the next year of operations, includes emergency loans used to keep your company ARUTES & OWNERS halvent should you run out of cash during the EQUITY year. Long Term Debt. The company's long term debat is in the form of bonds, and this represents ecounts Payable The total value of your bonds. Common Stock Current De The amount of capital invested by shareholders Tong Term Dat In the company Retained Earnings. The profis that the company chose to keep instead of paying to shareholders as dividends. Total abilities Common Stock Retained Earnings $123617 100.0% $115,552 $9.516 515 717 527209 7.74 12.74 220 S8781 55.725 3072 552.462 $1200 549.240 $12.443 553 360 $S9 094 47 % 571.174 57.6% Total Equity Total Lab. &0. Equity $123.617 100.0% $115.552 Cash Flow Statement 2018 520.139 56.455 52 511 56.220 5735 (511 277) 52083 53.996 52 99 $23.222 51.620 une com e cash caniowe from operating Activ Account during the year Casinction assive numbers and Netcome Los) sash withdrawals as negative numbers. The Carshow Statement Depreciation excellent tool for diagnosing emergency loans. When negative cash flows Extraordinary gais ses will cod positives you are forced to seek emergency funding for Accounts Payable example s are bad and you find your carrying an abundance of Inventory excessiven the report would show the increase in invertory huge negative cash Bow Too much unexpected inventory could out Accounts Recevable your infows, exhaust your starting cash and force you to be for money Net cash from operations o keep your company afloat. Cash Flows from Investing Activities Plantrovements Cash Flow Summary Cash Flows from Financing Activities: Dividende Andreas Sales of Common Stock Purchase of Common Stock 15.000 Cash from long tomm debl. 10.000 Retirement of longe det 6.000 Change in current de net) Not carsh from financing activites Not change in cash position -5,000 Closing cash position -10.000 Operations Finance Chg Cash Operations Investment Finance 516,072 (53.520) $13.333) 50 (51.935) SO 57 533 59912 5541 SO 52.070 (512.809) 510.559 5257) 510,845 531 800 532.057 Annual Report Andrews 2019 Income Statement (Pro ) And OS BE 52424 S. 336.62 1 000 Variable Coate wewe $7,017 $12.50 16.00 2 AM 156 27 $10,015 $11.567 51/4 0.425 $14.350 SSSSSS entory Car Total Veratie 520.157 53313 524 602 ST 511,766 20212 512,250 574 3419 Period Coat Depreciation SORA RAD 52.200 52.000 51.000 3070 Promo 51.200 2000 280 35 740 $1200 $1.200 $1.000 $1.000 O $200 5470054427 SSSSSS Sales Admin Period 888888 $1.254 51920 Met Margin 56.015 $15.472 7.824 2235 0 219 U m er bor boss incurred to produce the broduct that was inventory Carry Cost theo r y unsod pods in inventory Depreciation Calculadora line 15 yedepreciation of plant value RD Costa RED department expenditures for product Admin on overhead is estimated 15% of Promotions. The promotion budget for each product Sales: The sales foron budget for nach product other Charges not included in other c aries such as Fees, Write Offs, and from. The fees include money paid to investmentbarkers and brokerage firms to issue new od or bonds plus consulting for your instructor might s . Write-offs include the loss you might experience when you se pocity or liquidate inventory as the result of eliminating a production in the mountappens negative amount, then you actually made money on the liquidation of capacity invory. EBIT Caming Before Interest and Taxes Short Term Interest interest expense based on last year's current debt, including short form debil, long form holes that have become du gency for Long Term Interest interest paid on outstanding bonds Tax Income tax based upon a 35% tax rate. Profit Sharing Profits shared with employees under the labor contre, Net Pront CBT minus interests and profit 596 Shorts $1.0 Long Term interest 53357 ST Pro Sharing 5411 Net Profit 520,139 Variable Margins 2008 Andres 0.3% 12,3% 30.0% 200% 100% DON E332 2 2 2 Profit History Market Share History $20,000 $15.000 $10.000 $5,000 2018 2019 2015 2016 2017 2018 2019 ROE History Asset Turnover History 888 536.495 22 Total Period 1303 5,740 54.740 AM Net Margin 37,164 $8,015 $15.472 7.224 50 Definitions Un l imes List price. Direct Labor Labor costs incurred to produce the product that was sold Inventory Carny cost the cost o carry unsold goods in inventory Depreciation: Calculated on straight-line 15-year depreciation of plant value R&D Costa RAD department expenditures for each product Admin Administration overhead is c ated at 1.5% of sales. Promotions: The promotion budget for each product Sales: The salesforce budget for rach product Other: Charges not included in other categories such as Fees, W e Ofsand TOM The fees include money paid to investment bankers and brokerage firms to issue new sodes or bonds plus consulting fees your instructor might assess. Write-offs include the loss you might experience when you sel capacity or liquidate inventory as the result of liminating a production line. If the amount appears as a negative amount, then you actually made money on the liquidation of capacity or inventory. EBIT: Earnings Before Interest and Taxes Short Term Interest Interest expense based on last year's current debt, including short term debt, long term notes that have become due, and emergency loans. Long Term Interest Interest pas outstanding bonds. Tree: Income tax based upon a 35% tax rate. Pront Sharting Profissha with employees under the labor contract. Not Pront EBIT minus interest, taxes, and profit sharing. $29 536 46 Short Term Interest $1.490 Long Term Interest $3357 $11.006 Pe Sharing 5411 Net Profit 520,139 Variable Margins 2008 Andrews 0.0% 22.3% 0.9% 2.1% 8.895 0.3 12.3% 00% 592 2 2 2 Profit History Market Share History $20,000 $15.000 $10,000 55,000 2015 2016 2017 2018 2019 2016 2017 2018 2019 ROE History Asset Turnover History 2015 2018 2019 2015 2016 2017 2018 2019 2016 2017 ROS History ROA History 8 2016 2017 2018 2019 2015 2016 2017 2018 2015 Annual Report 2019 Page 2 


Step by Step Solution
There are 3 Steps involved in it
Step: 1

Get Instant Access to Expert-Tailored Solutions
See step-by-step solutions with expert insights and AI powered tools for academic success
Step: 2

Step: 3

Ace Your Homework with AI
Get the answers you need in no time with our AI-driven, step-by-step assistance
Get Started


