- I need help with some Statistics math homework. Images of the questions that I need help with are below. Thanks:)
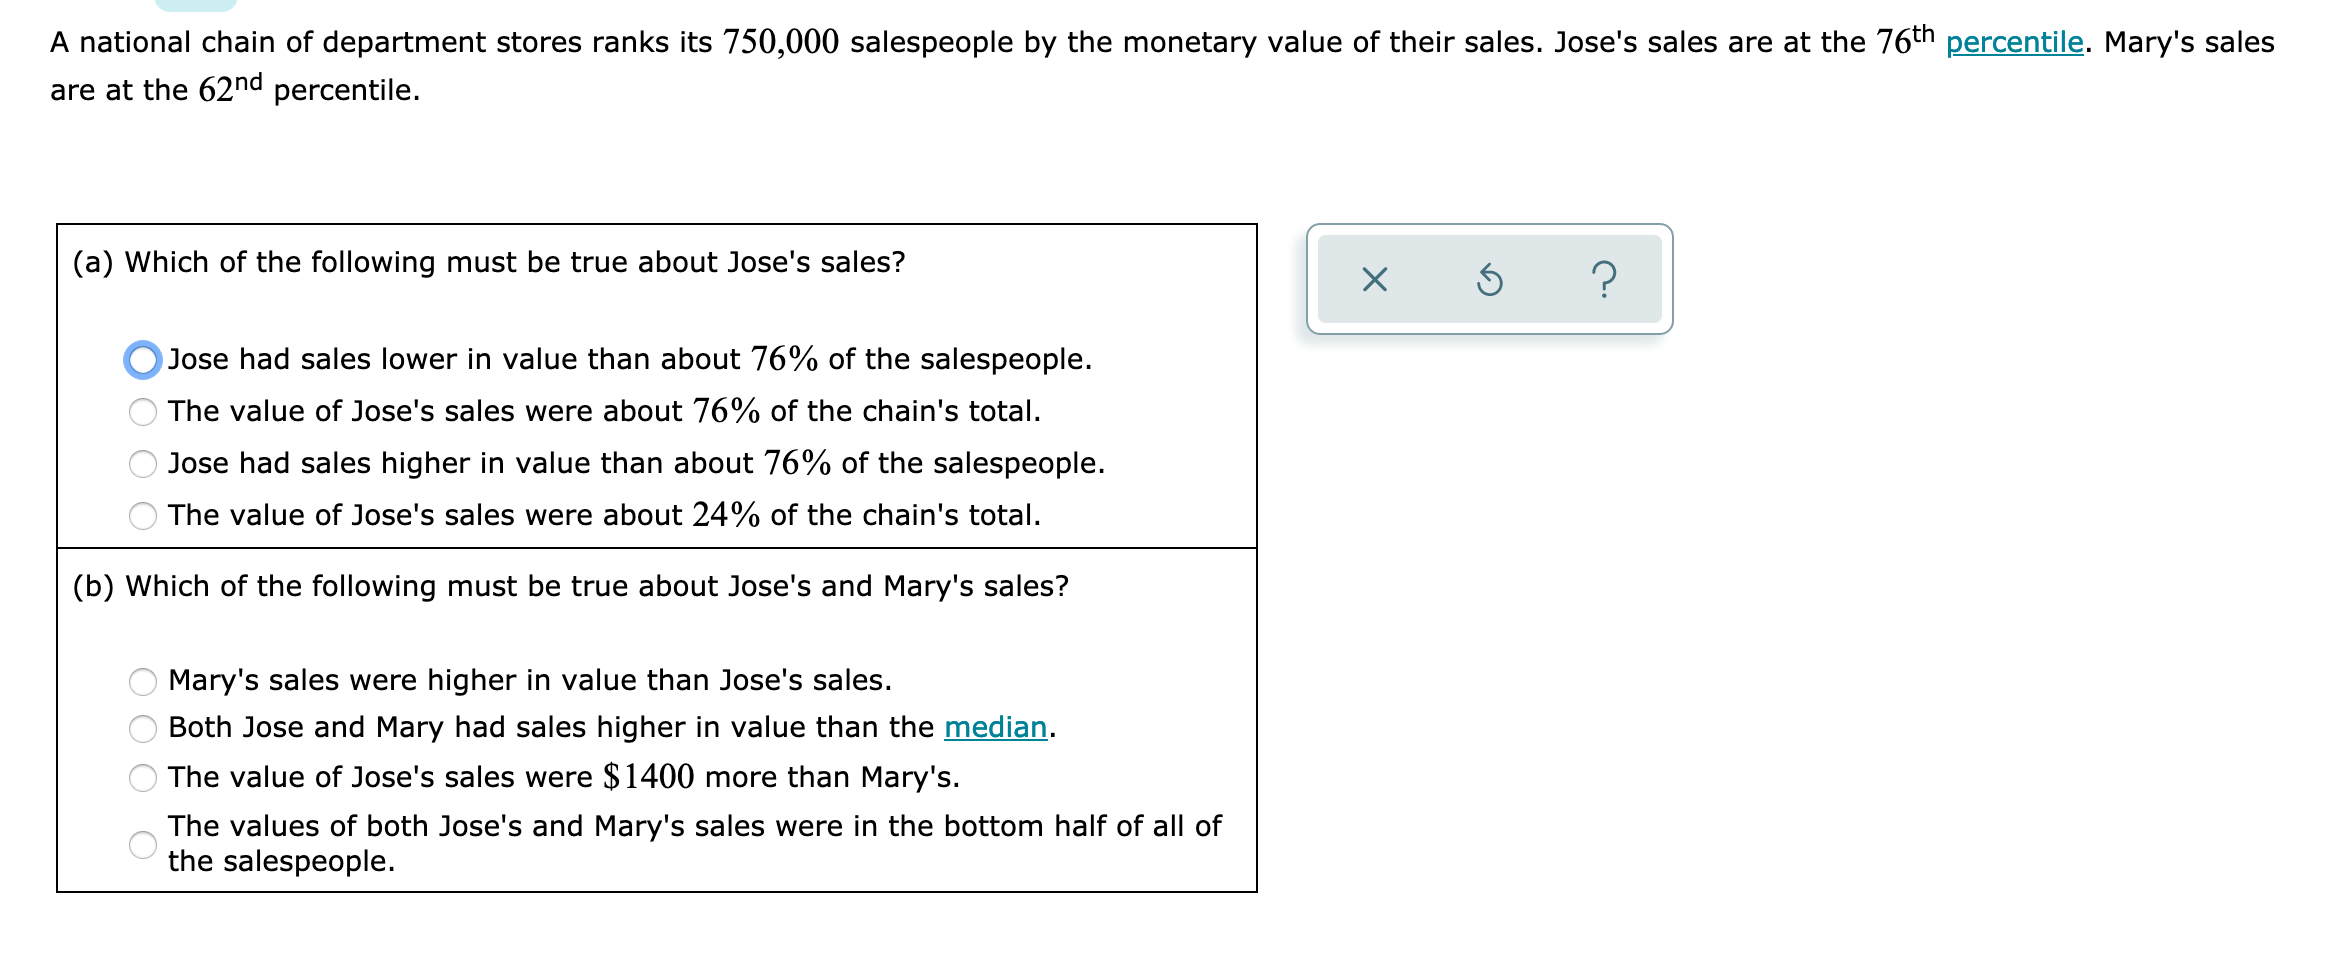
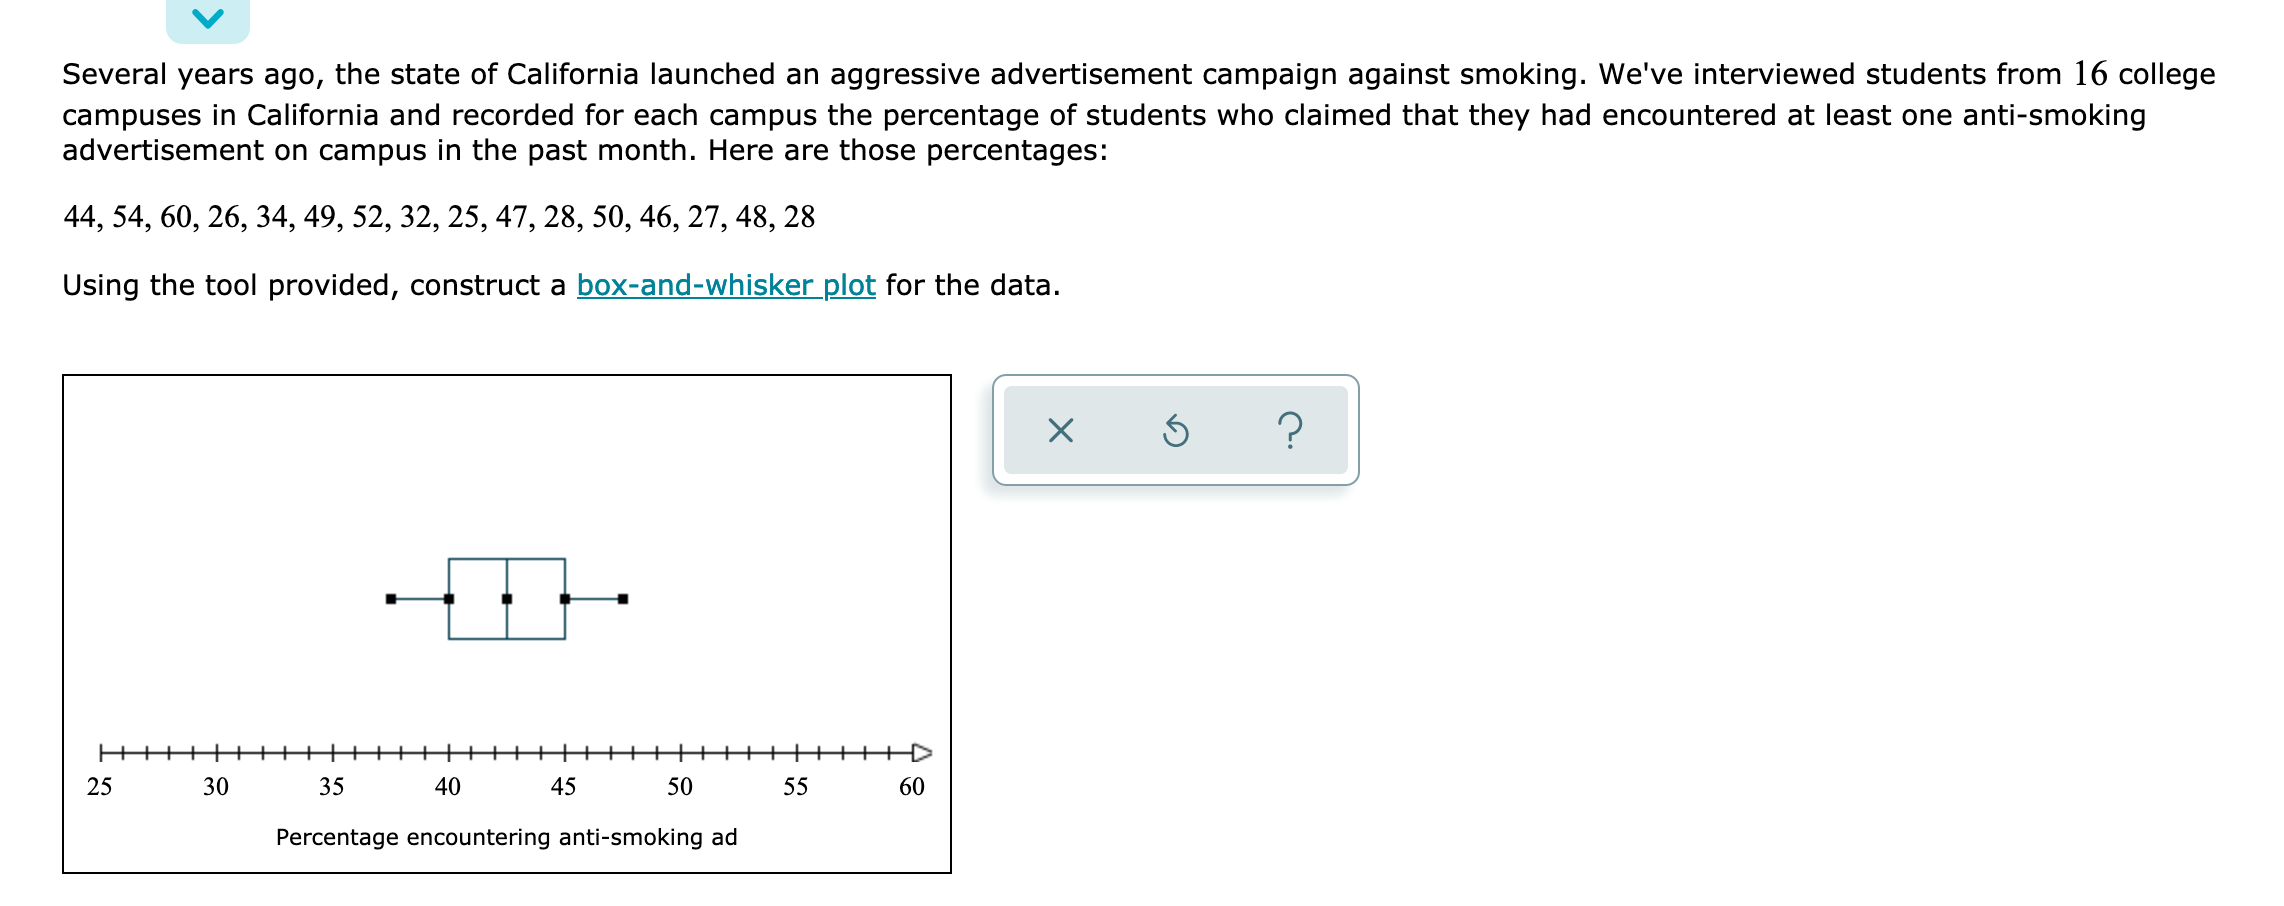
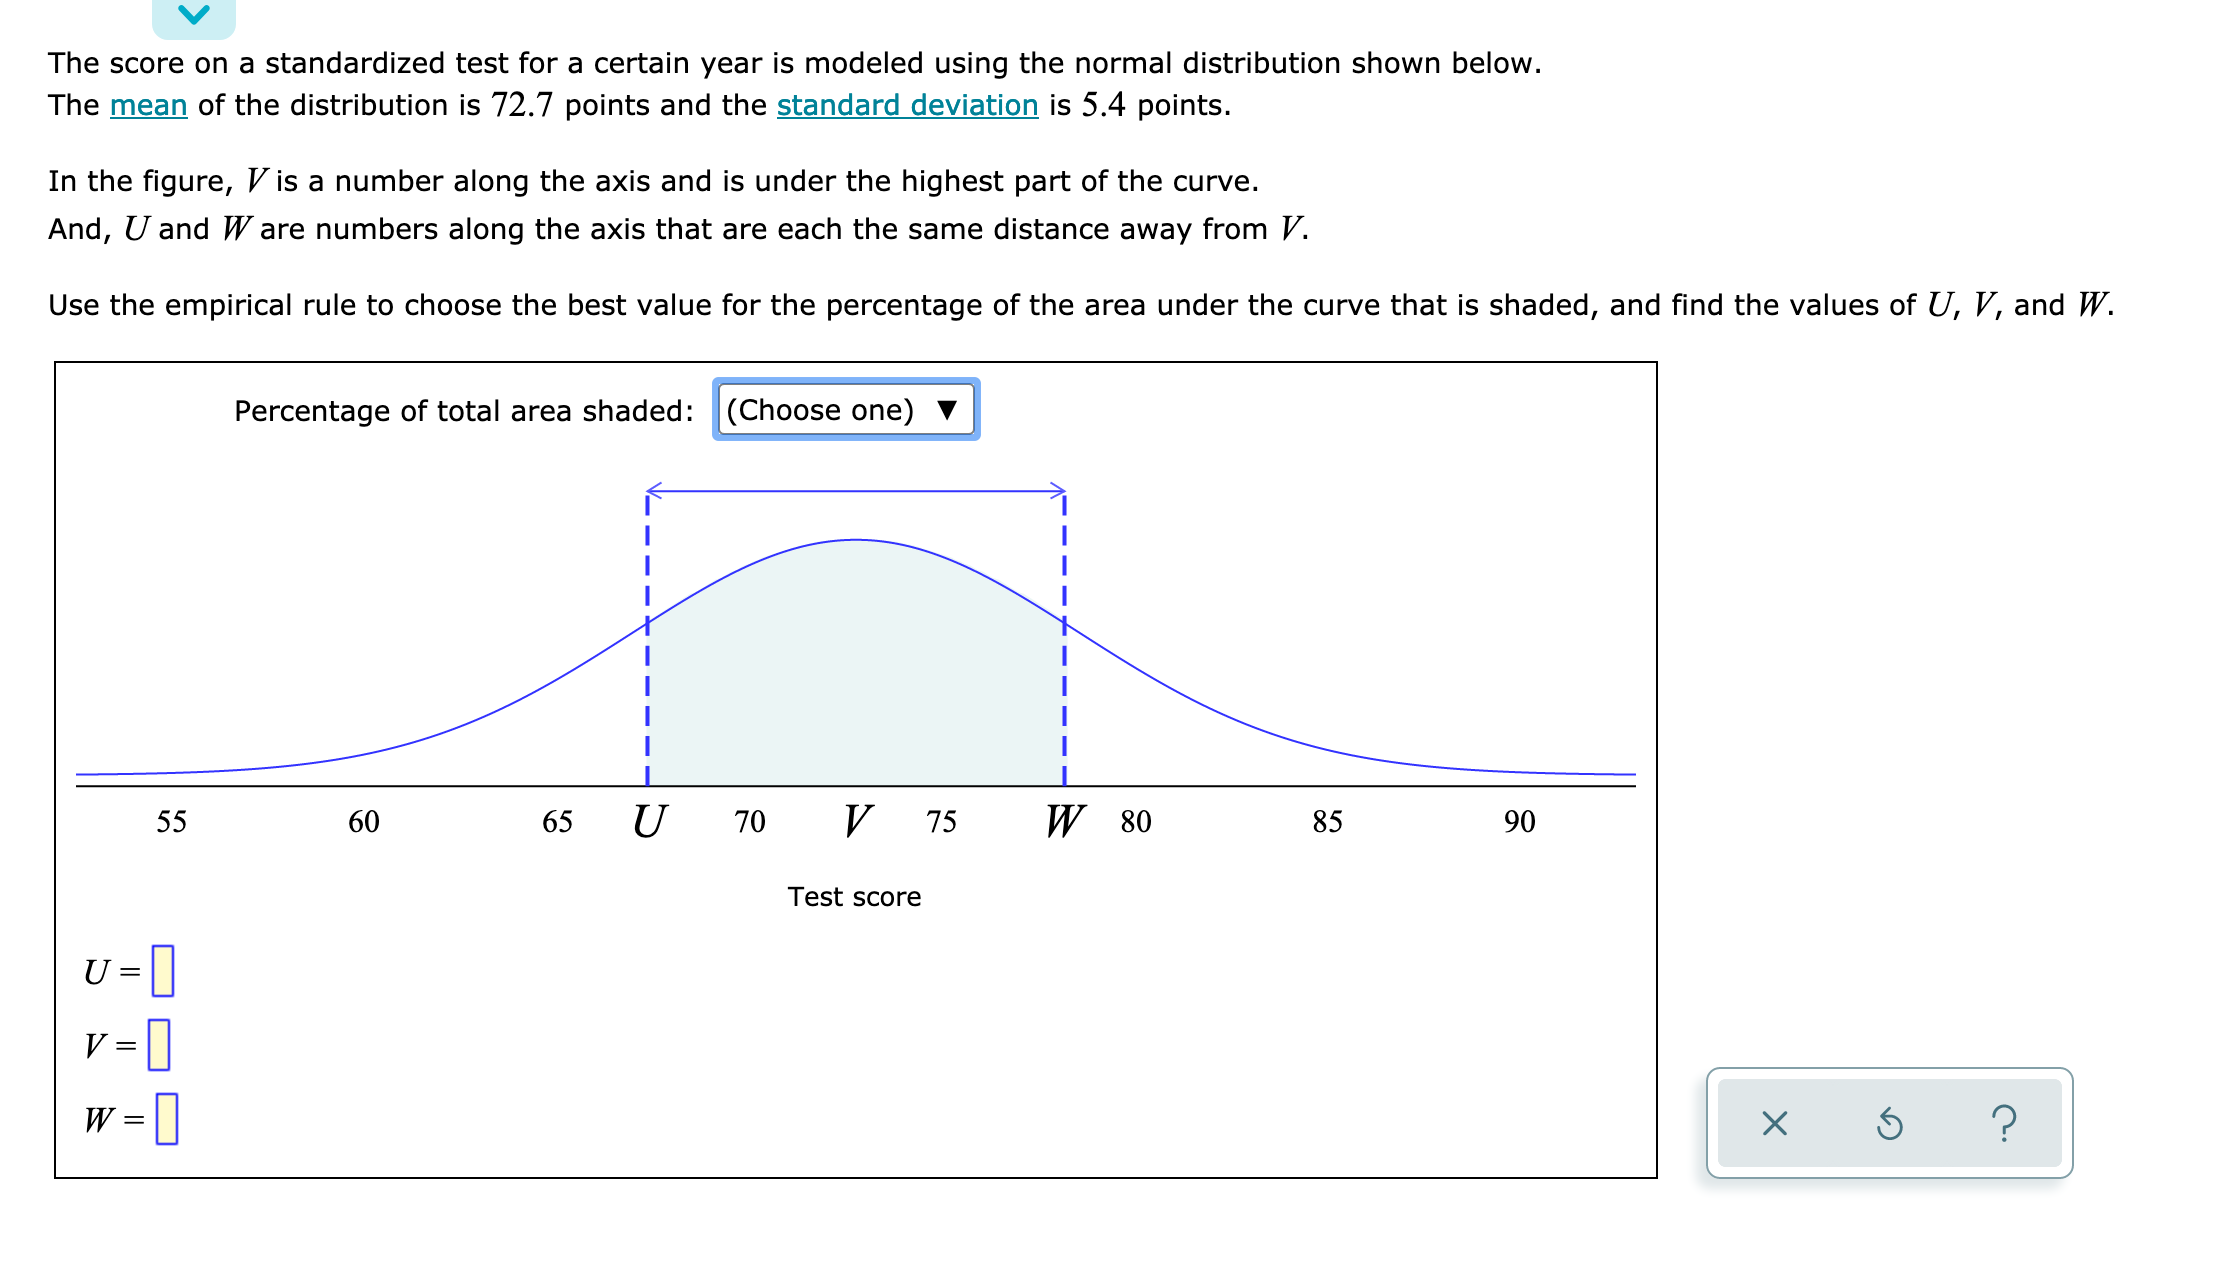
Suppose that the lengths of human pregnancies are normally distributed with a mean of 266 days and a standard deviation of 14 days. Complete the following statements. (a) Approximately 7 of pregnancies have lengths between 252 days and 280 days. (b) Approximately 95% of pregnancies have lengths between [1 days and [I days. A national chain of department stores ranks its 750,000 salespeople by the monetary value of their sales. Jose's sales are at the 76th percentile. Mary's sales are at the 62nd percentile. (a) Which of the following must be true about Jose's sales? X ? Jose had sales lower in value than about 76% of the salespeople. The value of Jose's sales were about 76% of the chain's total. Jose had sales higher in value than about 76% of the salespeople. O The value of Jose's sales were about 24% of the chain's total. (b) Which of the following must be true about Jose's and Mary's sales? Mary's sales were higher in value than Jose's sales. Both Jose and Mary had sales higher in value than the median. The value of Jose's sales were $ 1400 more than Mary's. O The values of both Jose's and Mary's sales were in the bottom half of all of the salespeople.V Several years ago, the state of California launched an aggressive advertisement campaign against smoking. We've interviewed students from 16 college campuses in California and recorded for each campus the percentage of students who claimed that they had encountered at least one anti-smoking advertisement on campus in the past month. Here are those percentages: 44, 54, 60, 26, 34, 49, 52, 32, 25, 47, 28, 50, 46, 27, 48, 28 Using the tool provided, construct a box-and-whisker [M for the data. { lHlllHOllHHlHHlilillilillllHD 30 35 40 45 50 55 Percentage encountering antismoking ad The score on a standardized test for a certain year is modeled using the normal distribution shown below. The mean of the distribution is 72.7 points and the standard deviation is 5.4 points. In the figure, I is a number along the axis and is under the highest part of the curve. And, U and Ware numbers along the axis that are each the same distance away from V. Use the empirical rule to choose the best value for the percentage of the area under the curve that is shaded, and find the values of U, V, and W. Percentage of total area shaded: (Choose one) 55 60 65 U 70 V 75 W 8 85 90 Test score U =| V = W = X 5


