

Answered step by step
Verified Expert Solution
Question
1 Approved Answer
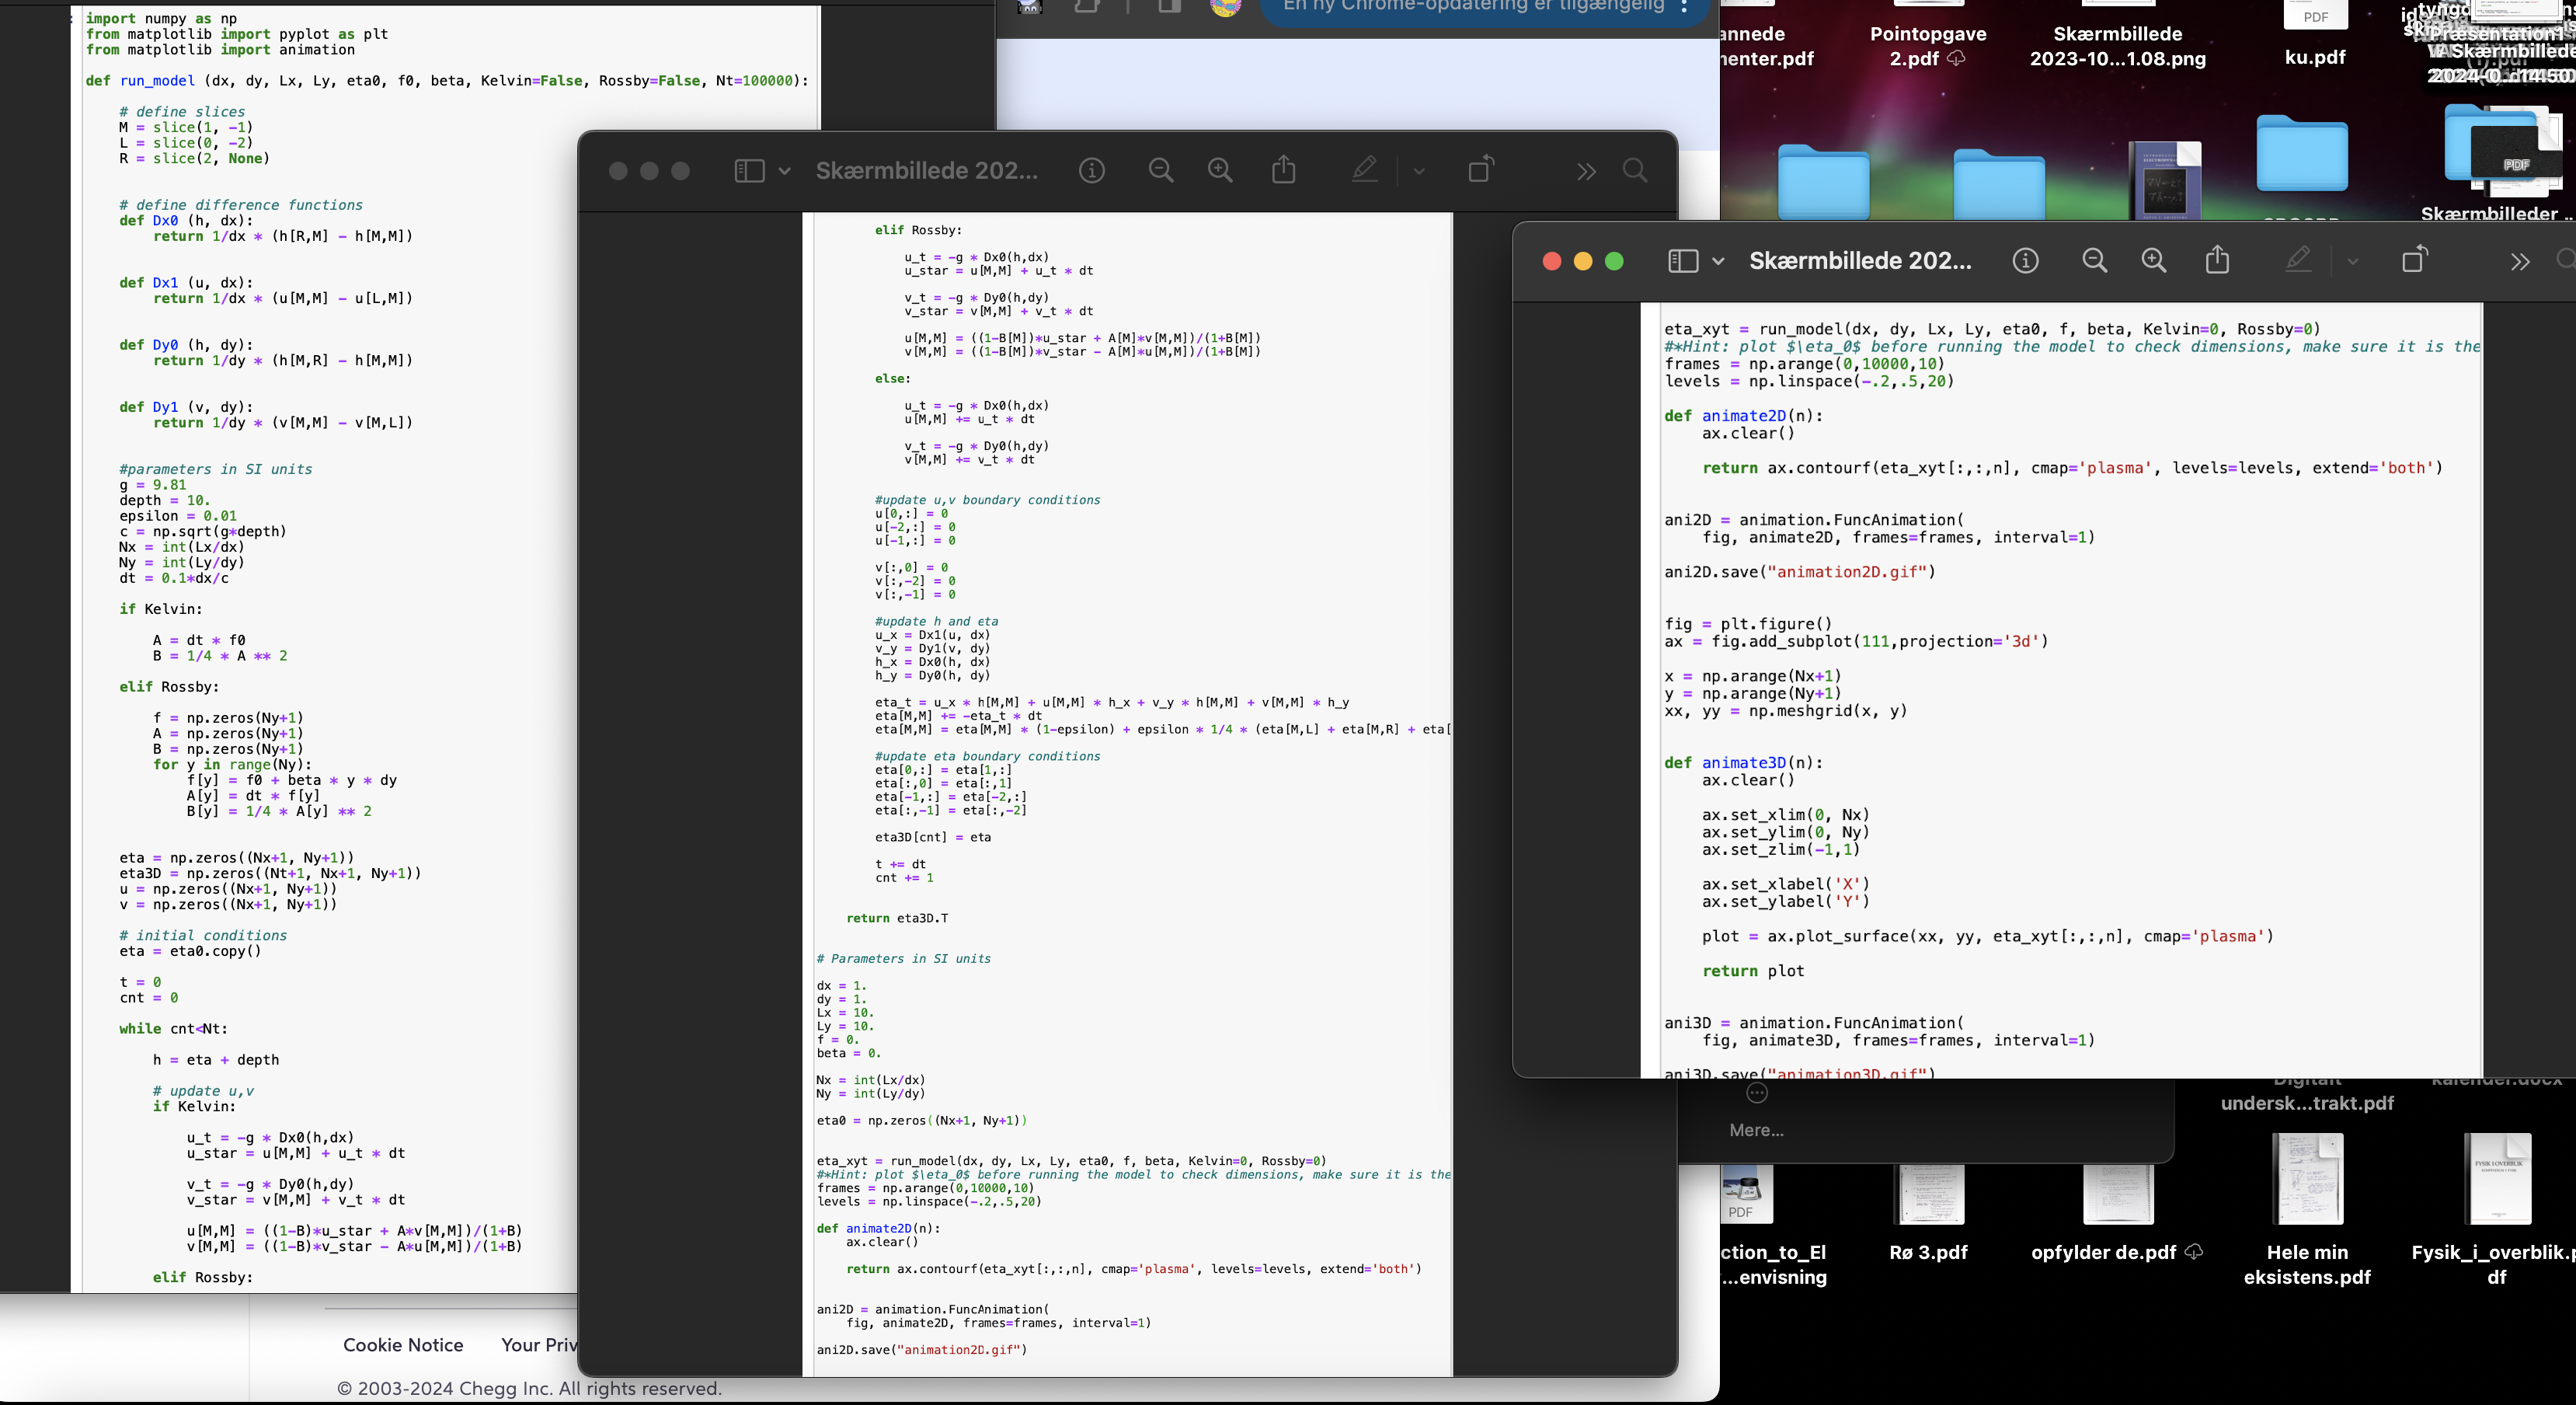
I need help with the coding of the simulation: i have a picture of the reffered code untouched. i tried adjusting it but i always
I need help with the coding of the simulation:
i have a picture of the reffered code untouched. i tried adjusting it but i always get a plain or ugly plot. eta
seems to be all
s which i do not understand why. i need a code that can do the simulation and calculate the phase speed,
and make a Hovmoller diagram but if you do not have time for that its fair
pls help me im so lost. Problem : THE SHALLOW WATER MODEL
You have been provided with the Jupyter Notebook code which you can use to simulate surface gravity waves.
Gravity waves are the waves that you see in a pond when you throw a rock into it They radiate away
from the source of disturbance in a circular pattern. The analytical form of gravity waves can be found from
the linearised Navier Stokes equation see chapter especially equations and in "Fluid
Mechanics" Kundu Cohen and Dowling,
A Hovmller diagram is a type of plot widely used in meteorology and geophysics. It is typically a D plot
where a scalar value such as temperature or sea elevation is plotted along one spatial dimension or
against time. An example of a Hovmller diagram can be seen in figure
Figure : An example of a Hovmller diagram. One specific position is chosen in the D basin where the
sea elevation is simulated as a function of and time. The remaining D slice is plotted as a Hovmller
diagram. The black dashed lines indicate the times at which the peak of the wave is in the middle of the basin,
and at the edges of the basin.
Kelvin waves appear on the boundary. Their amplitude decays exponentially away from the boundary, and in
a closed basin, they slide counterclockwise along the walls. They appear when the basin is large enough to
contain waves with low frequencies comparable to the rotation of the Earth. With Kelvin waves, we assume
that the Coriolis parameter, is constant. This is a good approximation for scales of small latitude angles, ie
basin lengths up to See chapter in "Fluid Mechanics" Kundu Cohen and Dowling,
for discussion about Kelvin waves.
Formulate a hypothesis: what phase speed do you expect for a Kelvin wave? Why?
Simulate a Kelvin wave using the model provided. You can either find the phase speed using a Hov
mller diagram, or track one of the peaks of the waves in the dimensional numerical output of the
simulation.
Report the phase speed you found supported by relevant figures. Did the phase speed meet your expec
tation? Whywhy not?
Step by Step Solution
There are 3 Steps involved in it
Step: 1

Get Instant Access to Expert-Tailored Solutions
See step-by-step solutions with expert insights and AI powered tools for academic success
Step: 2

Step: 3
Ace Your Homework with AI
Get the answers you need in no time with our AI-driven, step-by-step assistance
Get Started
Database And Expert Systems Applications 15th International Conference Dexa 2004 Zaragoza Spain August 30 September 3 2004 Proceedings Lncs 3180
Authors: Fernando Galindo ,Makoto Takizawa ,Roland Traunmuller
2004th Edition
3540229361, 978-3540229360