

Answered step by step
Verified Expert Solution
Question
1 Approved Answer
I need help with the flowchart for function 2 question 2 23 Trip Distance 1 The table below is a partial capture of the average
I need help with the flowchart for function 2 question 2
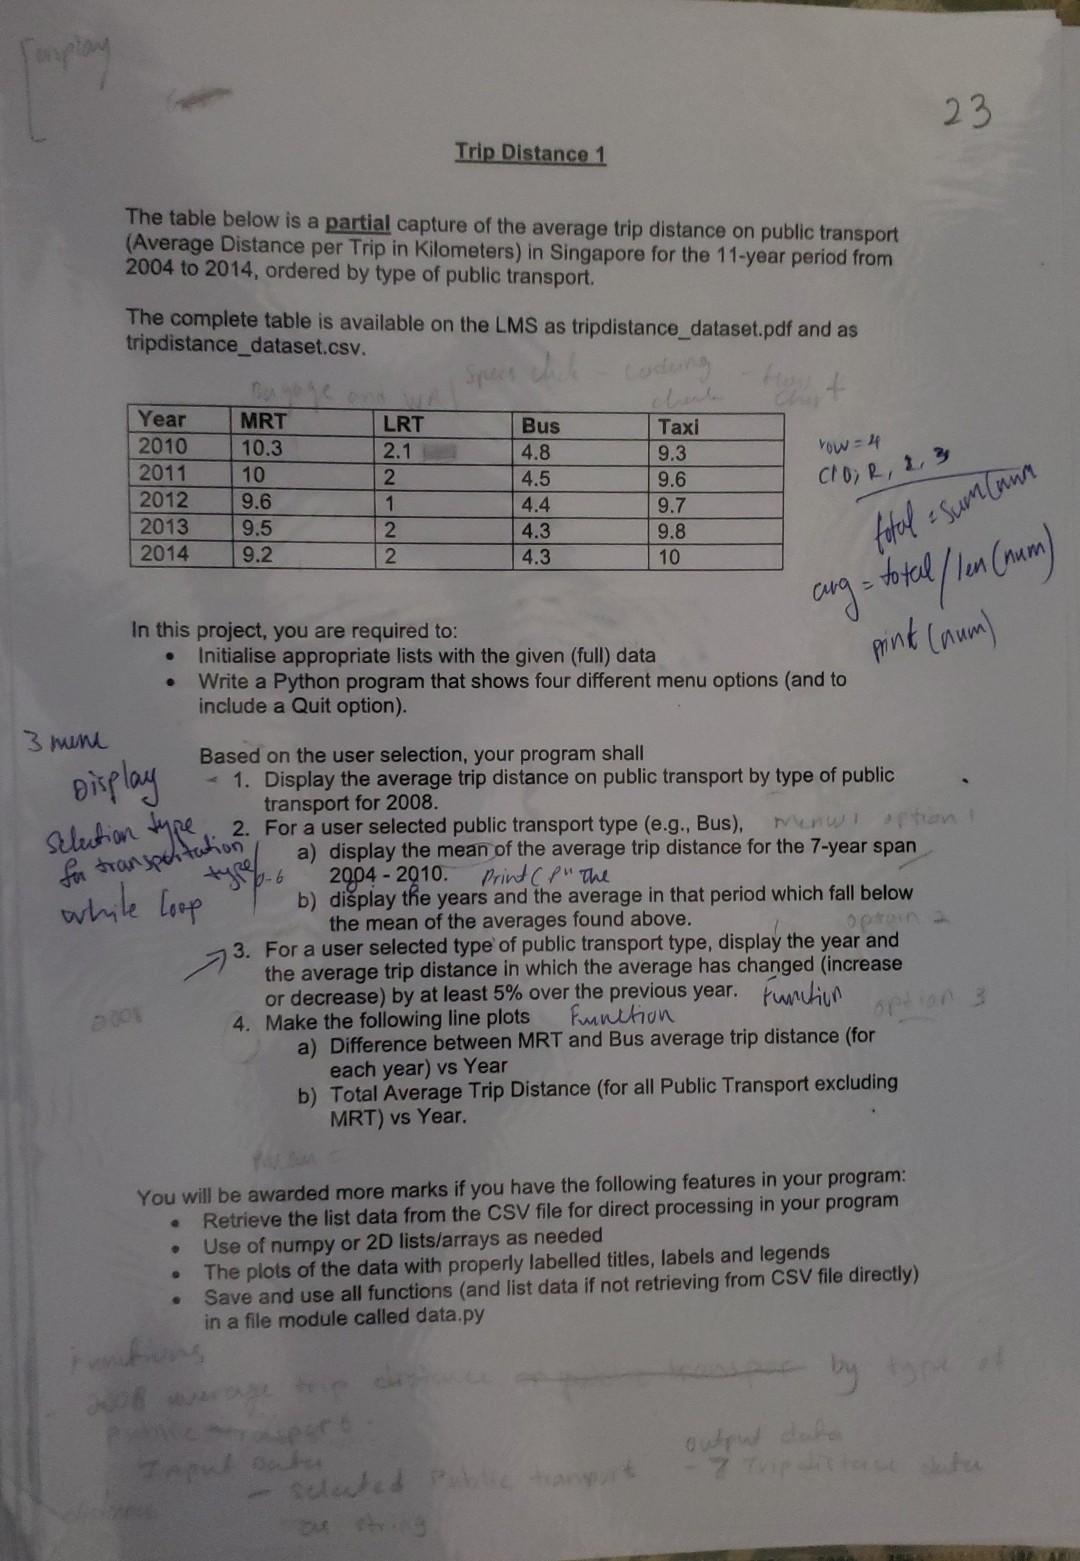
23 Trip Distance 1 The table below is a partial capture of the average trip distance on public transport (Average Distance per Trip in Kilometers) in Singapore for the 11-year period from 2004 to 2014, ordered by type of public transport The complete table is available on the LMS as tripdistance_dataset.pdf and as tripdistance_dataset.csv. LRT 2.1 row = 4 Year 2010 2011 2012 2013 2014 MRT 10.3 10 9.6 9.5 9.2 Bus 4.8 4.5 4.4 4.3 4.3 NNNN Taxi 9.3 9.6 9.7 9.8 10 ClOR, 23 totul esum tann ang = totallen (num) pind (num) Display sclution type In this project, you are required to: Initialise appropriate lists with the given (full) data Write a Python program that shows four different menu options (and to include a Quit option). 3 mone Based on the user selection, your program shall - 1. Display the average trip distance on public transport by type of public transport for 2008. 2. For a user selected public transport type (e.g., Bus), Minwi a) display the mean of the average trip distance for the 7-year span 2004 - 2010 Print CP" The while Loop b) display the years and the average in that period which fall below the mean of the averages found above. optron 3. For a user selected type of public transport type, display the year and the average trip distance in which the average has changed (increase or decrease) by at least 5% over the previous year. Function 4. Make the following line plots Funition a) Difference between MRT and Bus average trip distance (for each year) vs Year b) Total Average Trip Distance (for all Public Transport excluding MRT) vs Year. for transpoitation You will be awarded more marks if you have the following features in your program: Retrieve the list data from the CSV file for direct processing in your program Use of numpy or 2D lists/arrays as needed The plots of the data with properly labelled titles, labels and legends Save and use all functions (and list data if not retrieving from CSV file directly) in a file module called data.py Teploty tranpit 23 Trip Distance 1 The table below is a partial capture of the average trip distance on public transport (Average Distance per Trip in Kilometers) in Singapore for the 11-year period from 2004 to 2014, ordered by type of public transport The complete table is available on the LMS as tripdistance_dataset.pdf and as tripdistance_dataset.csv. LRT 2.1 row = 4 Year 2010 2011 2012 2013 2014 MRT 10.3 10 9.6 9.5 9.2 Bus 4.8 4.5 4.4 4.3 4.3 NNNN Taxi 9.3 9.6 9.7 9.8 10 ClOR, 23 totul esum tann ang = totallen (num) pind (num) Display sclution type In this project, you are required to: Initialise appropriate lists with the given (full) data Write a Python program that shows four different menu options (and to include a Quit option). 3 mone Based on the user selection, your program shall - 1. Display the average trip distance on public transport by type of public transport for 2008. 2. For a user selected public transport type (e.g., Bus), Minwi a) display the mean of the average trip distance for the 7-year span 2004 - 2010 Print CP" The while Loop b) display the years and the average in that period which fall below the mean of the averages found above. optron 3. For a user selected type of public transport type, display the year and the average trip distance in which the average has changed (increase or decrease) by at least 5% over the previous year. Function 4. Make the following line plots Funition a) Difference between MRT and Bus average trip distance (for each year) vs Year b) Total Average Trip Distance (for all Public Transport excluding MRT) vs Year. for transpoitation You will be awarded more marks if you have the following features in your program: Retrieve the list data from the CSV file for direct processing in your program Use of numpy or 2D lists/arrays as needed The plots of the data with properly labelled titles, labels and legends Save and use all functions (and list data if not retrieving from CSV file directly) in a file module called data.py Teploty tranpit
Step by Step Solution
There are 3 Steps involved in it
Step: 1

Get Instant Access to Expert-Tailored Solutions
See step-by-step solutions with expert insights and AI powered tools for academic success
Step: 2

Step: 3
Ace Your Homework with AI
Get the answers you need in no time with our AI-driven, step-by-step assistance
Get Started
Database Systems For Advanced Applications Dasfaa 2022 International Workshops Bdms Bdqm Gdma Iwbt Maqtds And Pmbd Virtual Event April 11 14 2022 Proceedings Lncs 13248
Authors: Uday Kiran Rage ,Vikram Goyal ,P. Krishna Reddy
1st Edition
3031112164, 978-3031112164