

Question
I need help with the following please Please implement using Python, Pandas, and dynamic programming algorithm The first 30 rows of the dataset Date RegionID
I need help with the following please
Please implement using Python, Pandas, and dynamic programming algorithm
The first 30 rows of the dataset
| Date | RegionID | RegionName | SizeRank | Zhvi | MoM | QoQ | YoY | 5Year | 10Year | PeakMonth | PeakQuarter | PeakZHVI | PctFallFromPeak | LastTimeAtCurrZHVI |
| 5/31/19 | 102001 | United States | 0 | 226800 | -0.001321 | -0.0008811 | 0.05390335 | 0.06274586 | 0.03015913 | 2019-03 | 2019-Q1 | 227200 | -0.0017606 | 2019-02 |
| 5/31/19 | 9 | California | 1 | 547700 | -0.0020044 | -0.0047247 | 0.01746238 | 0.06217506 | 0.048065 | 2019-01 | 2019-Q1 | 550500 | -0.0050863 | 2018-10 |
| 5/31/19 | 54 | Texas | 2 | 196100 | -0.0030503 | -0.0015275 | 0.05942734 | 0.07578106 | 0.04092943 | 2019-03 | 2019-Q1 | 197000 | -0.0045685 | 2019-02 |
| 5/31/19 | 43 | New York | 3 | 300400 | 0.00334001 | 0.01727057 | 0.07094474 | 0.04504882 | 0.01323088 | 2007-05 | 2007-Q2 | 305200 | -0.0157274 | 2006-06 |
| 5/31/19 | 14 | Florida | 4 | 233200 | -0.0021395 | -0.0051195 | 0.04714863 | 0.09168198 | 0.04162567 | 2006-08 | 2006-Q3 | 258900 | -0.0992661 | 2005-11 |
| 5/31/19 | 21 | Illinois | 5 | 181100 | -0.0011031 | 0.00110558 | 0.03663423 | 0.04561069 | 0.005052 | 2007-04 | 2007-Q2 | 203900 | -0.1118195 | 2005-01 |
| 5/31/19 | 47 | Pennsylvania | 6 | 173100 | -0.0028802 | -0.0063146 | 0.03343284 | 0.03879891 | 0.0136185 | 2019-02 | 2019-Q1 | 174200 | -0.0063146 | 2018-12 |
| 5/31/19 | 44 | Ohio | 7 | 139100 | -0.0028674 | -0.0050072 | 0.05378788 | 0.0523051 | 0.02190591 | 2019-03 | 2019-Q1 | 139900 | -0.0057184 | 2019-01 |
| 5/31/19 | 30 | Michigan | 8 | 152000 | -0.0006575 | 0.00197759 | 0.07344633 | 0.08368866 | 0.04296877 | 2019-04 | 2019-Q2 | 152100 | -0.0006575 | 2019-03 |
| 5/31/19 | 16 | Georgia | 9 | 188500 | -0.001589 | 0 | 0.08708189 | 0.07880842 | 0.02801046 | 2019-03 | 2019-Q1 | 188900 | -0.0021175 | 2019-02 |
| 5/31/19 | 36 | North Carolina | 10 | 185000 | 0.00108225 | 0.00488865 | 0.0762071 | 0.05702374 | 0.02277269 | 2019-05 | 2019-Q2 | 185000 | 0 | 2019-05 |
| 5/31/19 | 40 | New Jersey | 11 | 327400 | -0.0030451 | -0.0006105 | 0.03542062 | 0.04007649 | 0.00550842 | 2006-08 | 2006-Q3 | 375900 | -0.1290237 | 2005-04 |
| 5/31/19 | 56 | Virginia | 12 | 258800 | -0.0007722 | 0 | 0.03395925 | 0.0328313 | 0.01400381 | 2007-04 | 2007-Q2 | 265600 | -0.0256024 | 2005-11 |
| 5/31/19 | 59 | Washington | 13 | 387100 | -0.0015476 | -0.0025767 | 0.05190217 | 0.09216911 | 0.03917281 | 2019-03 | 2019-Q1 | 388400 | -0.0033471 | 2019-02 |
| 5/31/19 | 26 | Massachusetts | 14 | 407900 | -0.0036639 | -0.0060916 | 0.03554202 | 0.05533721 | 0.03332137 | 2019-03 | 2019-Q1 | 410600 | -0.0065757 | 2019-01 |
| 5/31/19 | 22 | Indiana | 15 | 144500 | -0.0006916 | 0.00486787 | 0.08810241 | 0.06513694 | 0.02654102 | 2019-04 | 2019-Q2 | 144600 | -0.0006916 | 2019-04 |
| 5/31/19 | 8 | Arizona | 16 | 253300 | -0.000789 | 0.00118577 | 0.05983264 | 0.07202514 | 0.0406834 | 2006-06 | 2006-Q2 | 269400 | -0.0597624 | 2005-11 |
| 5/31/19 | 53 | Tennessee | 17 | 167300 | 0 | 0.00119689 | 0.06424936 | 0.07140956 | 0.03421969 | 2019-03 | 2019-Q1 | 167400 | -0.0005974 | 2019-03 |
| 5/31/19 | 32 | Missouri | 18 | 161100 | -0.0024768 | -0.0024768 | 0.0591716 | 0.05104469 | 0.01927588 | 2019-03 | 2019-Q1 | 161700 | -0.0037106 | 2019-01 |
| 5/31/19 | 27 | Maryland | 19 | 289900 | -0.0037801 | -0.0058299 | 0.02510608 | 0.03532938 | 0.00955569 | 2006-12 | 2006-Q4 | 334800 | -0.1341099 | 2005-06 |
| 5/31/19 | 60 | Wisconsin | 20 | 187800 | 0 | 0.00374132 | 0.06342016 | 0.05035174 | 0.02063872 | 2019-05 | 2019-Q2 | 187800 | 0 | 2019-05 |
| 5/31/19 | 31 | Minnesota | 21 | 236700 | 0.00084567 | 0.00339127 | 0.05340454 | 0.06372581 | 0.03262538 | 2019-05 | 2019-Q2 | 236700 | 0 | 2019-05 |
| 5/31/19 | 10 | Colorado | 22 | 380200 | -0.0020997 | 0.00026309 | 0.0496963 | 0.09338724 | 0.05724463 | 2019-03 | 2019-Q1 | 381100 | -0.0023616 | 2019-03 |
| 5/31/19 | 4 | Alabama | 23 | 131200 | 0.00076278 | 0.00076278 | 0.0420969 | 0.03606554 | 0.02117276 | 2019-05 | 2019-Q2 | 131200 | 0 | 2019-05 |
| 5/31/19 | 51 | South Carolina | 24 | 167000 | 0.00059916 | 0.003003 | 0.05830165 | 0.05762431 | 0.02233585 | 2019-05 | 2019-Q2 | 167000 | 0 | 2019-05 |
| 5/31/19 | 25 | Louisiana | 25 | 145900 | -0.0006849 | -0.0088315 | 0.0062069 | 0.03456897 | 0.01485257 | 2018-11 | 2018-Q4 | 147700 | -0.0121869 | 2018-08 |
| 5/31/19 | 24 | Kentucky | 26 | 145400 | 0.00068823 | 0.00137741 | 0.05438724 | 0.05078462 | 0.0247173 | 2019-05 | 2019-Q2 | 145400 | 0 | 2019-05 |
| 5/31/19 | 46 | Oregon | 27 | 345800 | -0.0020202 | -0.0046056 | 0.03875038 | 0.08629993 | 0.04171159 | 2019-02 | 2019-Q1 | 347400 | -0.0046056 | 2019-01 |
| 5/31/19 | 45 | Oklahoma | 28 | 124000 | 0 | 0.0008071 | 0.03852596 | 0.05517057 | 0.02603059 | 2019-05 | 2019-Q2 | 124000 | 0 | 2019-05 |
We are skipping the first two rows and only using the columns: 'RegionName' as 'InvestmentName', 'Zhvi' as 'InvestmentCost', and '10Year' as 'EstimatedReturnOnInvestment'.
The investment amount is $1000000 (1 Million U.S. dollars).
This is my code of what I have. I think it is right but I am lost on the next step.
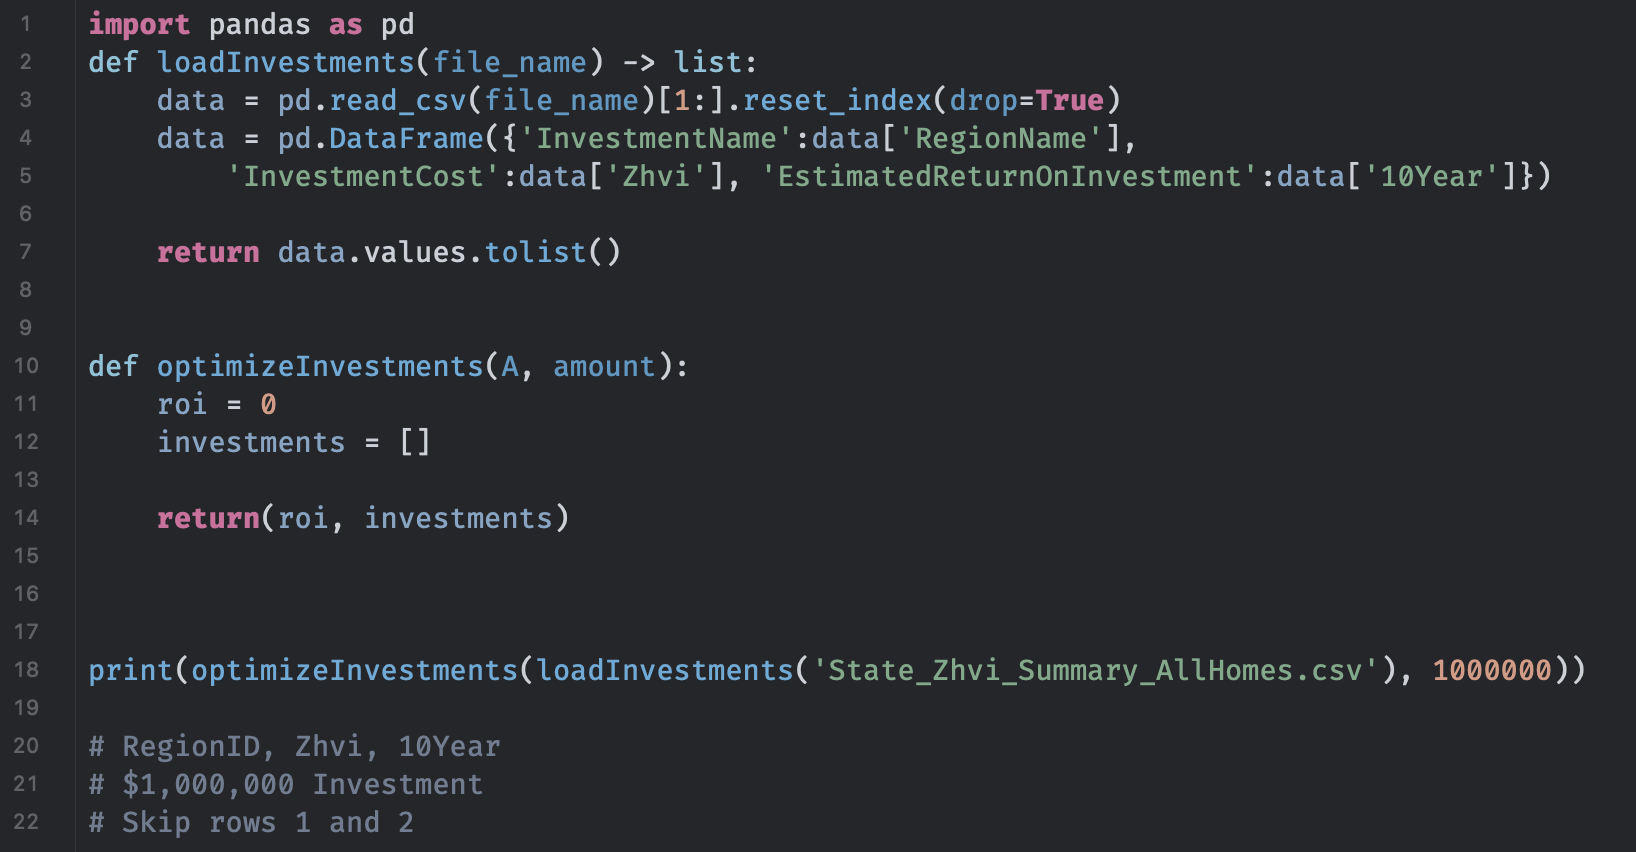
Copyable code:
import pandas as pd
def loadInvestments(file_name) -> list:
data = pd.read_csv(file_name)[1:].reset_index(drop=True)
data = pd.DataFrame({'InvestmentName':data['RegionName'],
'InvestmentCost':data['Zhvi'], 'EstimatedReturnOnInvestment':data['10Year']})
return data.values.tolist()
def optimizeInvestments(A, amount):
roi = 0
investments = []
return(roi, investments)
print(optimizeInvestments(loadInvestments('State_Zhvi_Summary_AllHomes.csv'), 1000000))
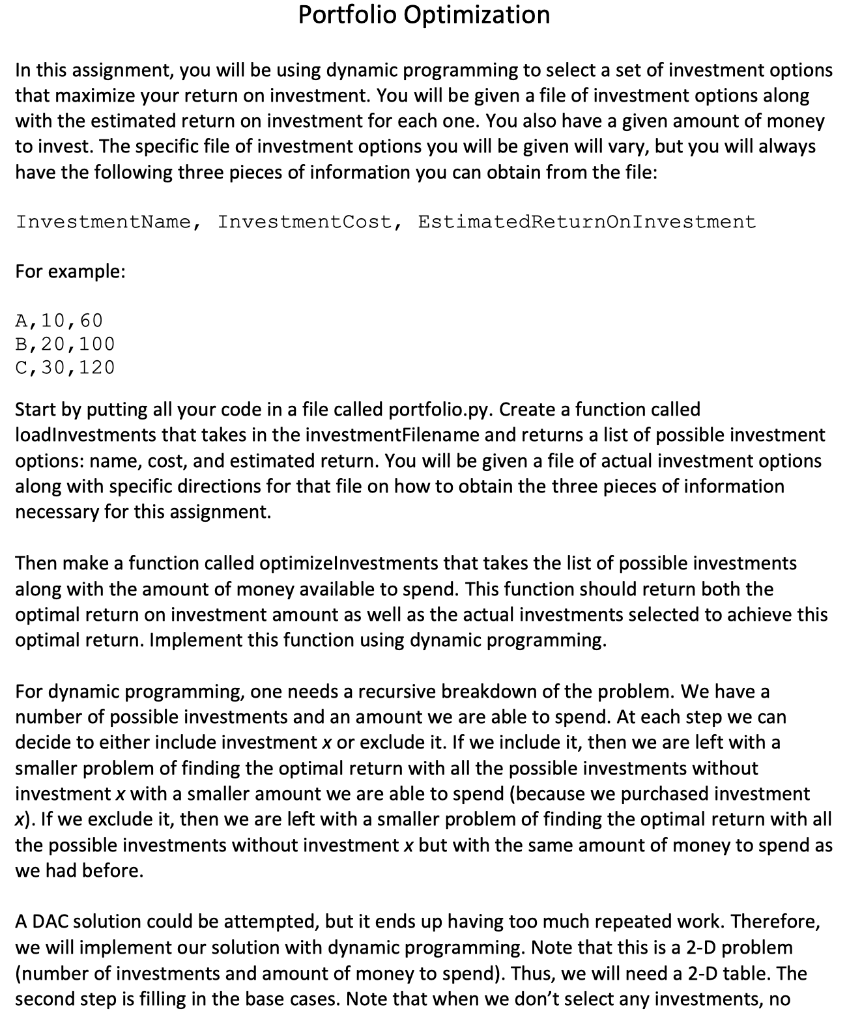
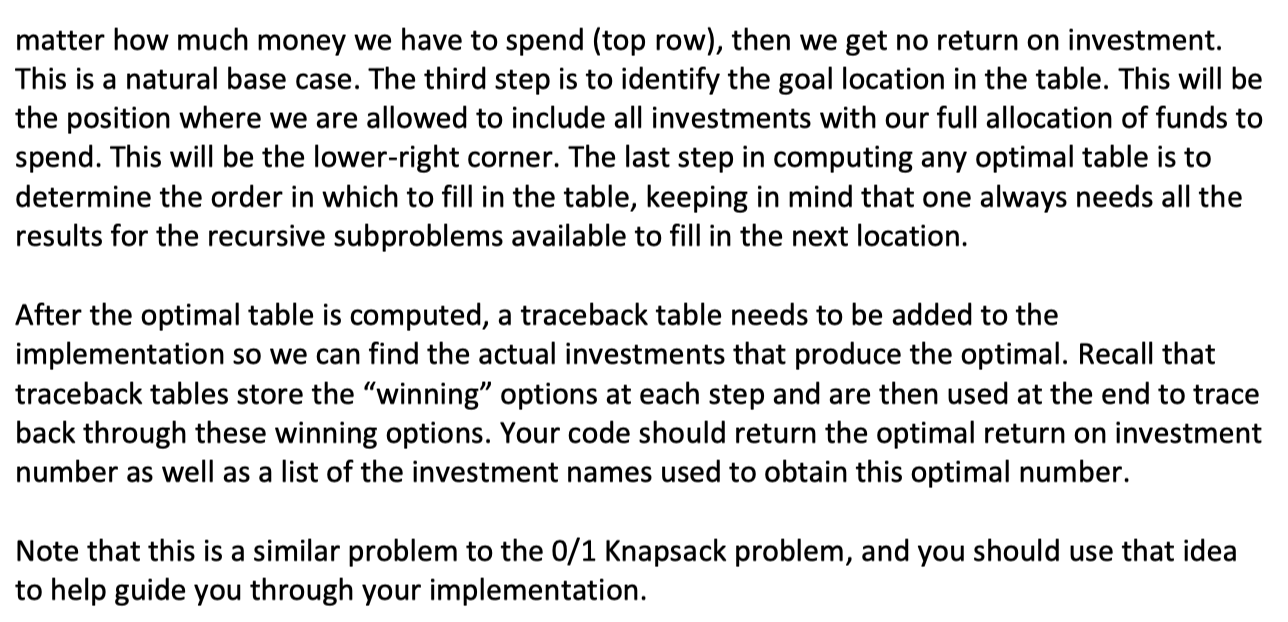
Portfolio Optimization In this assignment, you will be using dynamic programming to select a set of investment options that maximize your return on investment. You will be given a file of investment options along with the estimated return on investment for each one. You also have a given amount of money to invest. The specific file of investment options you will be given will vary, but you will always have the following three pieces of information you can obtain from the file: InvestmentName, Investment Cost, EstimatedReturnOnInvestment For example: A, 10,60 B, 20,100 C, 30, 120 Start by putting all your code in a file called portfolio.py. Create a function called loadinvestments that takes in the investmentFilename and returns a list of possible investment options: name, cost, and estimated return. You will be given a file of actual investment options along with specific directions for that file on how to obtain the three pieces of information necessary for this assignment. Then make a function called optimizelnvestments that takes the list of possible investments along with the amount of money available to spend. This function should return both the optimal return on investment amount as well as the actual investments selected to achieve this optimal return. Implement this function using dynamic programming. For dynamic programming, one needs a recursive breakdown of the problem. We have a number of possible investments and an amount we are able to spend. At each step we can decide to either include investment x or exclude it. If we include it, then we are left with a smaller problem of finding the optimal return with all the possible investments without investment x with a smaller amount we are able to spend (because we purchased investment x). If we exclude it, then we are left with a smaller problem of finding the optimal return with all the possible investments without investment x but with the same amount of money to spend as we had before. A DAC solution could be attempted, but it ends up having too much repeated work. Therefore, we will implement our solution with dynamic programming. Note that this is a 2-D problem (number of investments and amount of money to spend). Thus, we will need a 2-D table. The second step is filling in the base cases. Note that when we don't select any investments, no matter how much money we have to spend (top row), then we get no return on investment. This is a natural base case. The third step is to identify the goal location in the table. This will be the position where we are allowed to include all investments with our full allocation of funds to spend. This will be the lower-right corner. The last step in computing any optimal table is to determine the order in which to fill in the table, keeping in mind that one always needs all the results for the recursive subproblems available to fill in the next location. After the optimal table is computed, a traceback table needs to be added to the implementation so we can find the actual investments that produce the optimal. Recall that traceback tables store the winning" options at each step and are then used at the end to trace back through these winning options. Your code should return the optimal return on investment number as well as a list of the investment names used to obtain this optimal number. Note that this is a similar problem to the 0/1 Knapsack problem, and you should use that idea to help guide you through your implementation. 1 2 3 import pandas as pd def loadInvestments(file_name) -> list: data = pd.read_csv(file_name)[1:].reset_index(drop=True) data = pd.DataFrame({ 'InvestmentName':data['RegionName'], 'Investment Cost':data['Zhvi'], 'EstimatedReturnOnInvestment':data['10Year']}) 4 5 6 7 return data.values.tolist() 8 9 10 11 def optimizeInvestments(A, amount): roi = 0 investments = [] 12 13 14 return(roi, investments) 15 16 17 18 print(optimizeInvestments(loadInvestments('State_Zhvi_Summary_All Homes.csv'), 1000000)) 19 20 21 # RegionID, Zhvi, 10Year # $1,000,000 Investment # Skip rows 1 and 2 22 Portfolio Optimization In this assignment, you will be using dynamic programming to select a set of investment options that maximize your return on investment. You will be given a file of investment options along with the estimated return on investment for each one. You also have a given amount of money to invest. The specific file of investment options you will be given will vary, but you will always have the following three pieces of information you can obtain from the file: InvestmentName, Investment Cost, EstimatedReturnOnInvestment For example: A, 10,60 B, 20,100 C, 30, 120 Start by putting all your code in a file called portfolio.py. Create a function called loadinvestments that takes in the investmentFilename and returns a list of possible investment options: name, cost, and estimated return. You will be given a file of actual investment options along with specific directions for that file on how to obtain the three pieces of information necessary for this assignment. Then make a function called optimizelnvestments that takes the list of possible investments along with the amount of money available to spend. This function should return both the optimal return on investment amount as well as the actual investments selected to achieve this optimal return. Implement this function using dynamic programming. For dynamic programming, one needs a recursive breakdown of the problem. We have a number of possible investments and an amount we are able to spend. At each step we can decide to either include investment x or exclude it. If we include it, then we are left with a smaller problem of finding the optimal return with all the possible investments without investment x with a smaller amount we are able to spend (because we purchased investment x). If we exclude it, then we are left with a smaller problem of finding the optimal return with all the possible investments without investment x but with the same amount of money to spend as we had before. A DAC solution could be attempted, but it ends up having too much repeated work. Therefore, we will implement our solution with dynamic programming. Note that this is a 2-D problem (number of investments and amount of money to spend). Thus, we will need a 2-D table. The second step is filling in the base cases. Note that when we don't select any investments, no matter how much money we have to spend (top row), then we get no return on investment. This is a natural base case. The third step is to identify the goal location in the table. This will be the position where we are allowed to include all investments with our full allocation of funds to spend. This will be the lower-right corner. The last step in computing any optimal table is to determine the order in which to fill in the table, keeping in mind that one always needs all the results for the recursive subproblems available to fill in the next location. After the optimal table is computed, a traceback table needs to be added to the implementation so we can find the actual investments that produce the optimal. Recall that traceback tables store the winning" options at each step and are then used at the end to trace back through these winning options. Your code should return the optimal return on investment number as well as a list of the investment names used to obtain this optimal number. Note that this is a similar problem to the 0/1 Knapsack problem, and you should use that idea to help guide you through your implementation. 1 2 3 import pandas as pd def loadInvestments(file_name) -> list: data = pd.read_csv(file_name)[1:].reset_index(drop=True) data = pd.DataFrame({ 'InvestmentName':data['RegionName'], 'Investment Cost':data['Zhvi'], 'EstimatedReturnOnInvestment':data['10Year']}) 4 5 6 7 return data.values.tolist() 8 9 10 11 def optimizeInvestments(A, amount): roi = 0 investments = [] 12 13 14 return(roi, investments) 15 16 17 18 print(optimizeInvestments(loadInvestments('State_Zhvi_Summary_All Homes.csv'), 1000000)) 19 20 21 # RegionID, Zhvi, 10Year # $1,000,000 Investment # Skip rows 1 and 2 22Step by Step Solution
There are 3 Steps involved in it
Step: 1

Get Instant Access to Expert-Tailored Solutions
See step-by-step solutions with expert insights and AI powered tools for academic success
Step: 2

Step: 3
Ace Your Homework with AI
Get the answers you need in no time with our AI-driven, step-by-step assistance
Get Started
Fundamentals Of Database Systems
Authors: Sham Navathe,Ramez Elmasri
5th Edition
B01FGJTE0Q, 978-0805317558