Answered step by step
Verified Expert Solution
Link Copied!

Question

1 Approved Answer

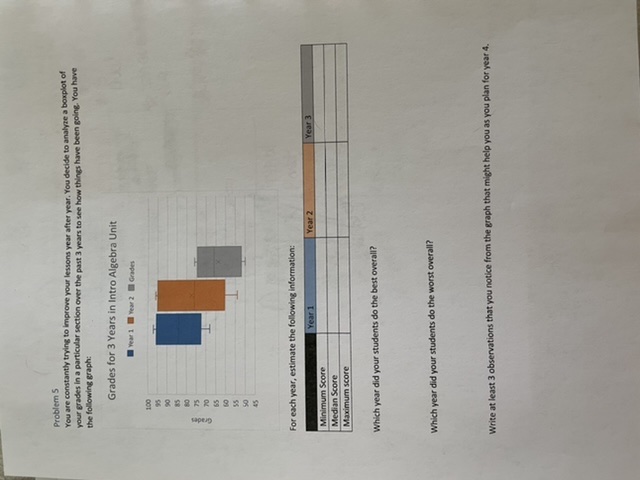
I need help with the following problem on the page, Problem 5. Thanks Problem 5 You are constantly trying to Improve your lessons year after

I need help with the following problem on the page, Problem 5. Thanks

image text in transcribed
Problem 5 You are constantly trying to Improve your lessons year after year. You decide to analyze a boxplot of your grades in a particular section over the past 3 years to see how things have been going. You have the following graph: Grades for 3 Years in Intro Algebra Unit For each year, estimate the following information; Year 1 Year 2 Year 3 Minimum Score Median Score Maximum score Which year did your students do the best overall? Which year did your students do the worst overall? Write at least 3 observations that you notice from the graph that might help you as you plan for year 4

Step by Step Solution

There are 3 Steps involved in it

Step: 1

blur-text-image

Get Instant Access to Expert-Tailored Solutions

See step-by-step solutions with expert insights and AI powered tools for academic success

Step: 2

blur-text-image

Step: 3

blur-text-image

Ace Your Homework with AI

Get the answers you need in no time with our AI-driven, step-by-step assistance

Get Started

Recommended Textbook for

More Books

Students also viewed these Mathematics questions

Question

For the standard normal density (x), show that 0(x) x(x).

Answered: 1 week ago