I need help with the following question. Thank You
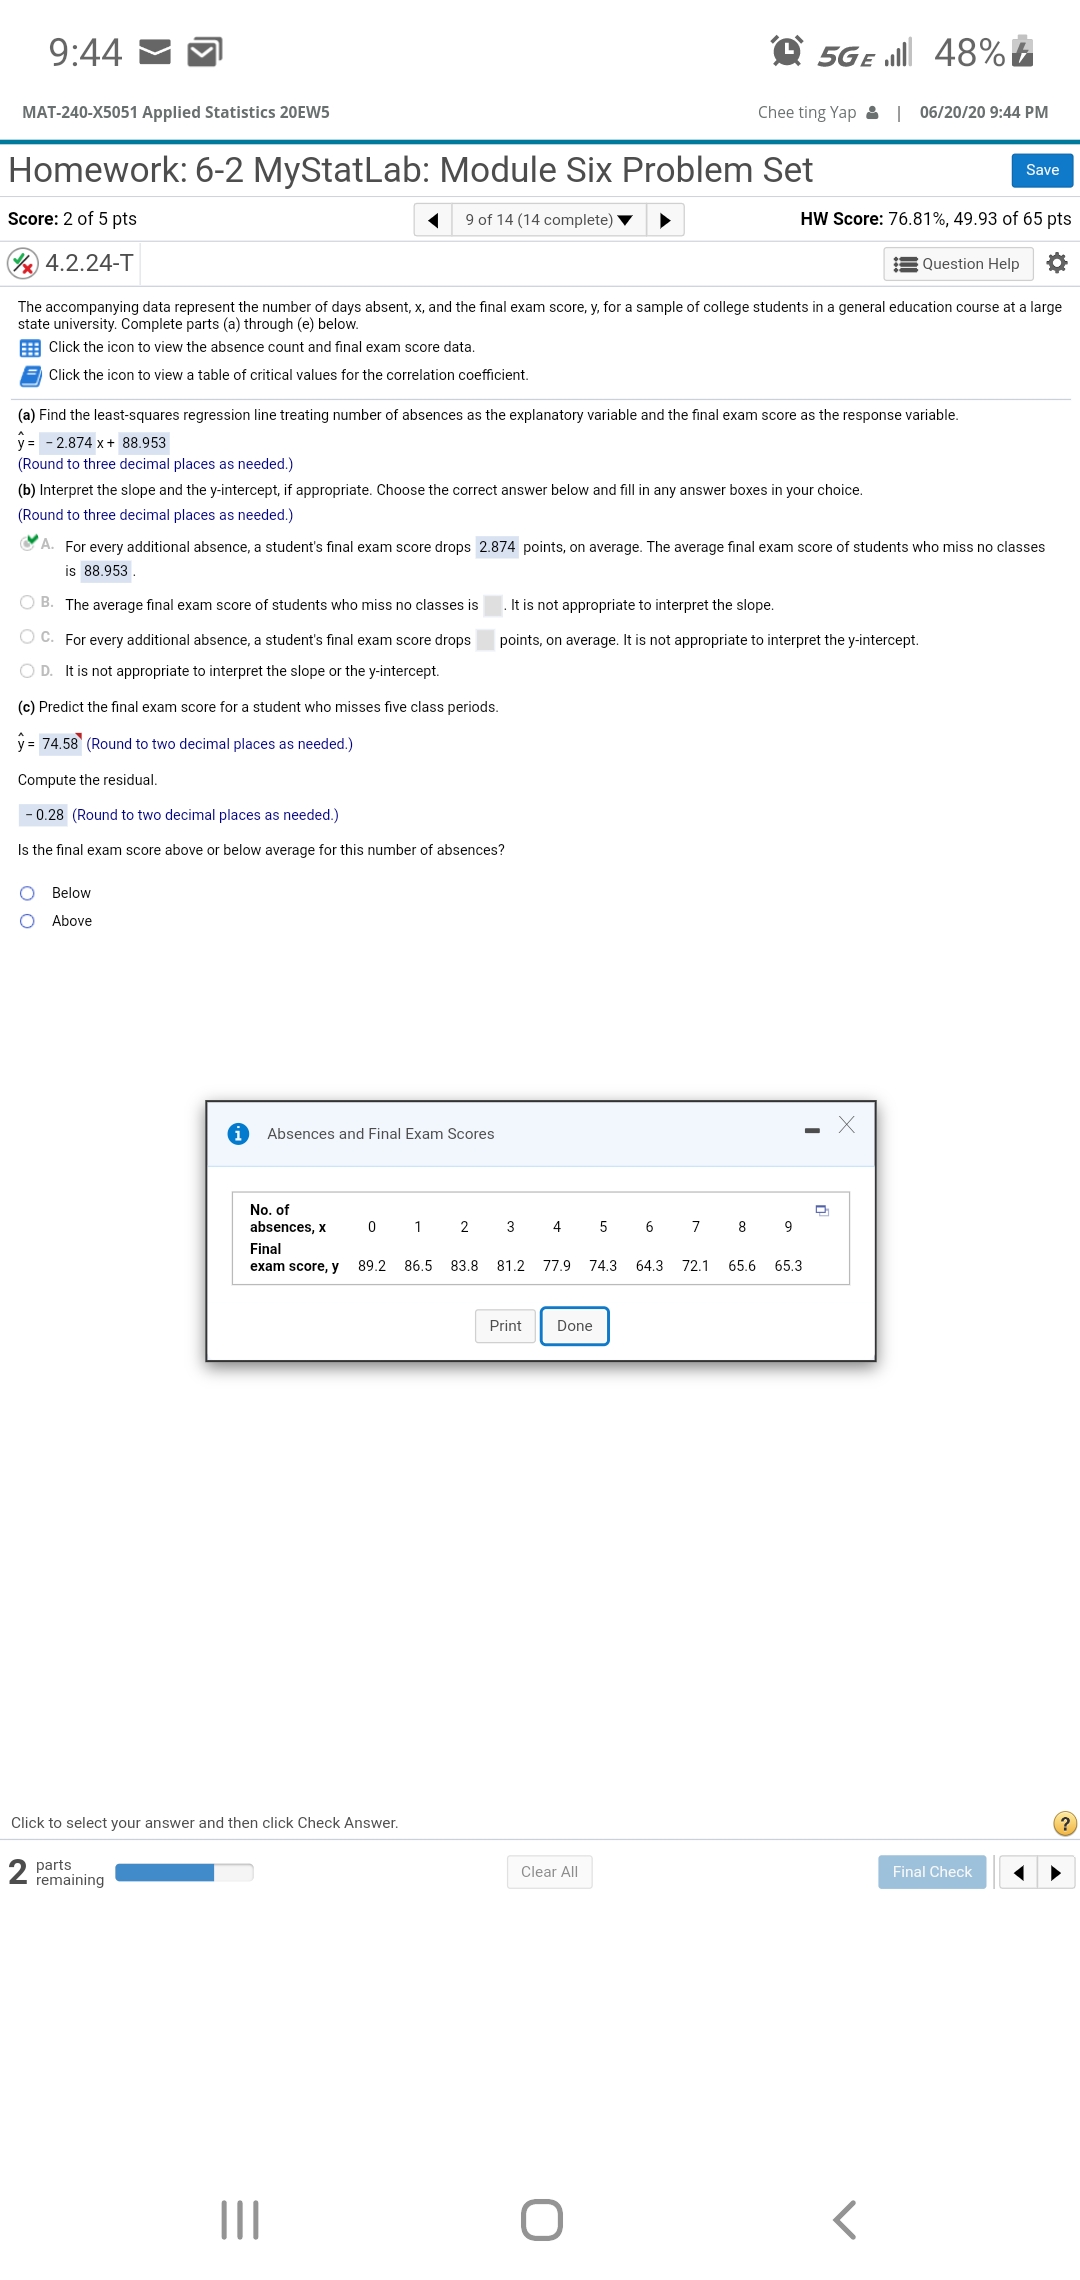
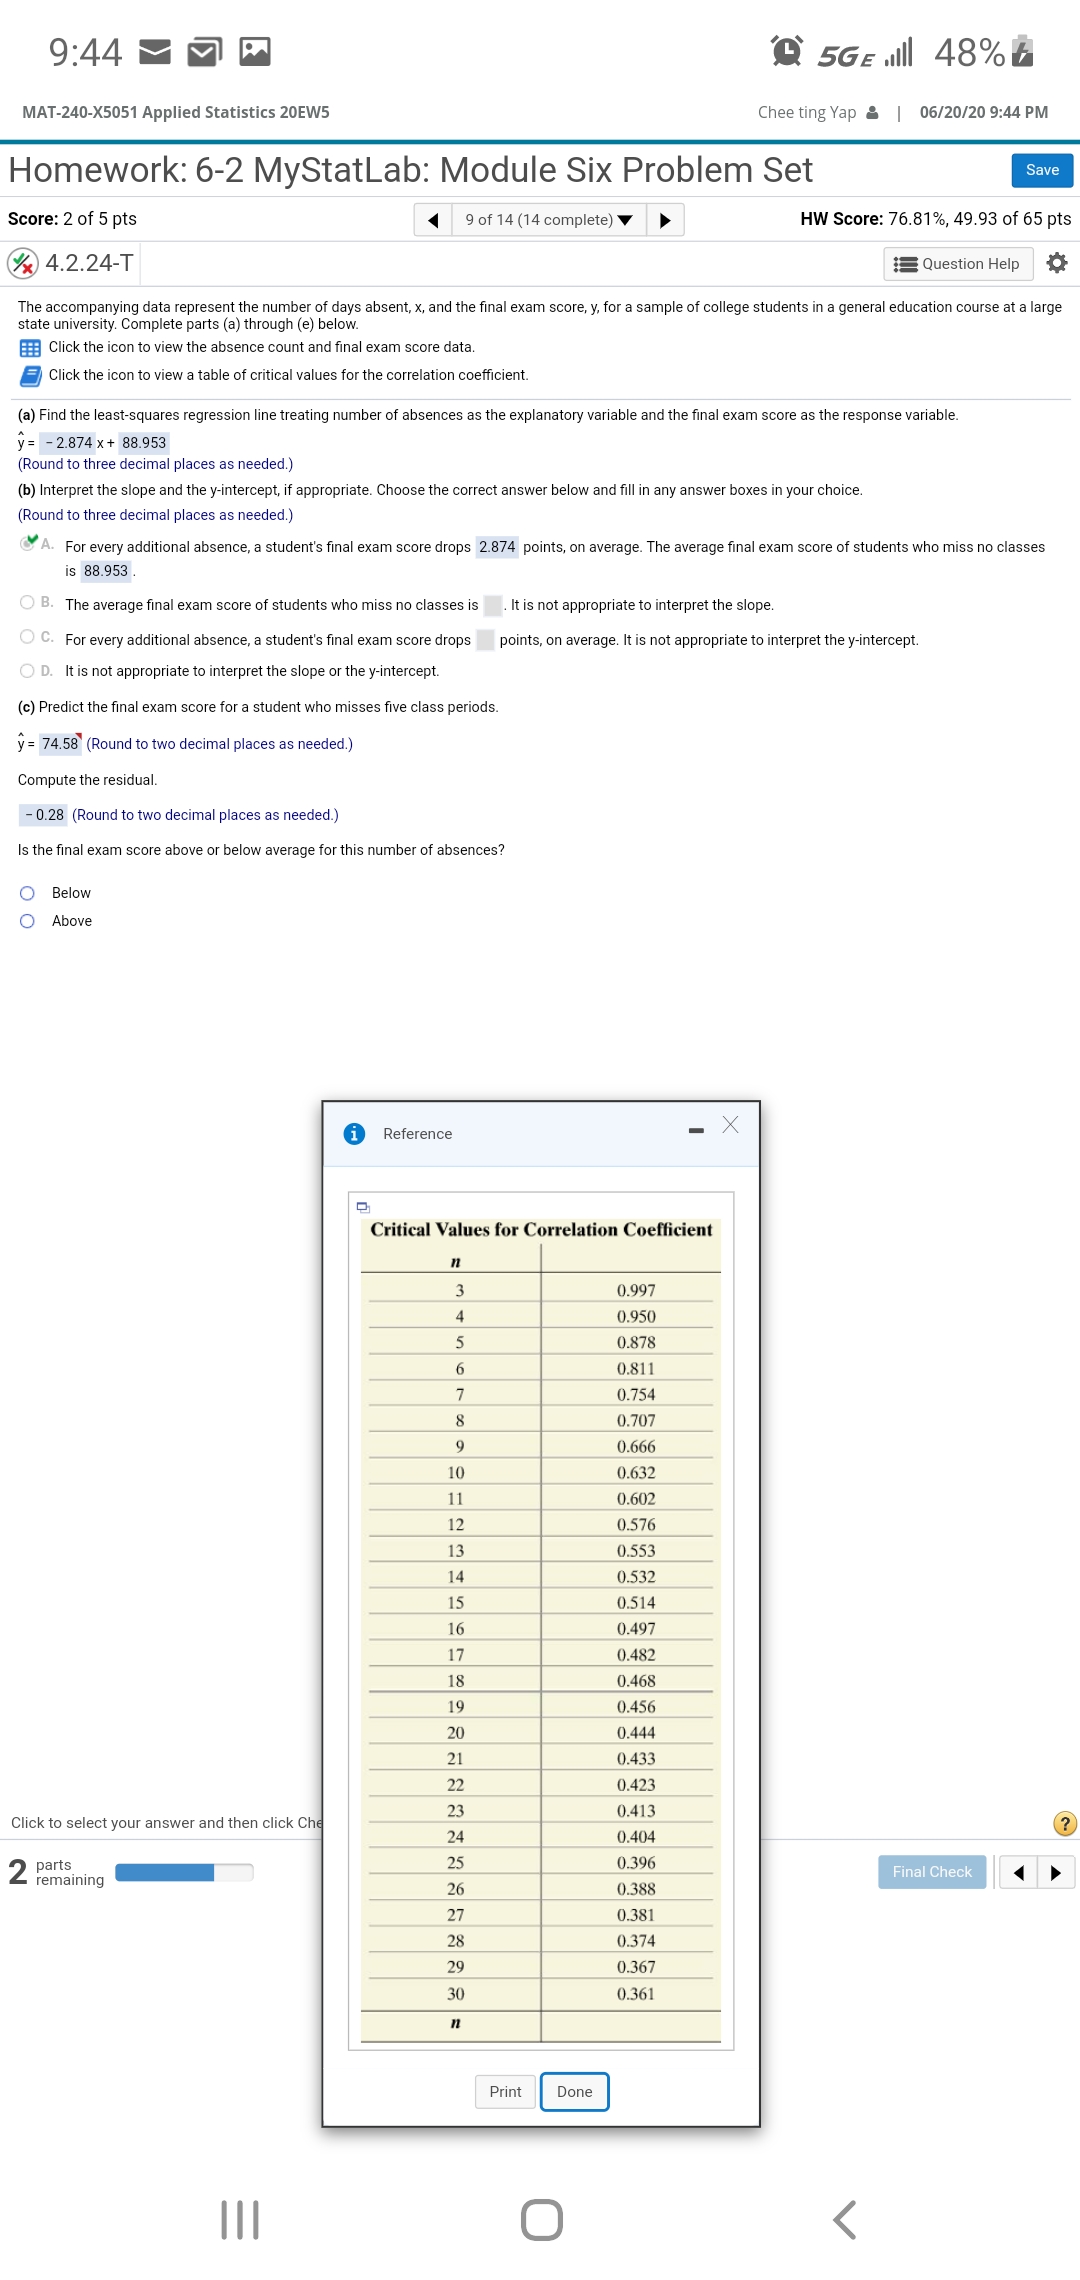
9:44 - M Q 5GE all 48%% MAT-240-X5051 Applied Statistics 20EW5 Chee ting Yap & | 06/20/20 9:44 PM Homework: 6-2 MyStatLab: Module Six Problem Set Save Score: 2 of 5 pts 9 of 14 (14 complete) HW Score: 76.81%, 49.93 of 65 pts VX 4.2.24-T Question Help The accompanying data represent the number of days absent, x, and the final exam score, y, for a sample of college students in a general education course at a large state university. Complete parts (a) through (e) below. Click the icon to view the absence count and final exam score data. Click the icon to view a table of critical values for the correlation coefficient. (a) Find the least-squares regression line treating number of absences as the explanatory variable and the final exam score as the response variable. y= - 2.874 x+ 88.953 (Round to three decimal places as needed.) (b) Interpret the slope and the y-intercept, if appropriate. Choose the correct answer below and fill in any answer boxes in your choice. (Round to three decimal places as needed.) A. For every additional absence, a student's final exam score drops 2.874 points, on average. The average final exam score of students who miss no classes is 88.953 . O B. The average final exam score of students who miss no classes is . It is not appropriate to interpret the slope. O C. For every additional absence, a student's final exam score drops points, on average. It is not appropriate to interpret the y-intercept. O D. It is not appropriate to interpret the slope or the y-intercept (c) Predict the final exam score for a student who misses five class periods. y= 74.58 (Round to two decimal places as needed.) Compute the residual. - 0.28 (Round to two decimal places as needed.) Is the final exam score above or below average for this number of absences? O Below Above i Absences and Final Exam Scores - X No. of absences, x 0 1 2 3 4 5 6 7 8 9 Final exam score, y 89.2 86.5 83.8 81.2 77.9 74.3 64.3 72.1 65.6 65.3 Print Done Click to select your answer and then click Check Answer. ? 2 parts remaining Clear All Final Check O9:44 - MP Q 5GE all 48%% MAT-240-X5051 Applied Statistics 20EW5 Chee ting Yap & | 06/20/20 9:44 PM Homework: 6-2 MyStatLab: Module Six Problem Set Save Score: 2 of 5 pts 9 of 14 (14 complete) HW Score: 76.81%, 49.93 of 65 pts VX 4.2.24-T Question Help The accompanying data represent the number of days absent, x, and the final exam score, y, for a sample of college students in a general education course at a large state university. Complete parts (a) through (e) below. Click the icon to view the absence count and final exam score data. Click the icon to view a table of critical values for the correlation coefficient. (a) Find the least-squares regression line treating number of absences as the explanatory variable and the final exam score as the response variable. y= - 2.874 x+ 88.953 (Round to three decimal places as needed.) (b) Interpret the slope and the y-intercept, if appropriate. Choose the correct answer below and fill in any answer boxes in your choice. (Round to three decimal places as needed.) A. For every additional absence, a student's final exam score drops 2.874 points, on average. The average final exam score of students who miss no classes is 88.953 . O B. The average final exam score of students who miss no classes is . It is not appropriate to interpret the slope. O C. For every additional absence, a student's final exam score drops points, on average. It is not appropriate to interpret the y-intercept. O D. It is not appropriate to interpret the slope or the y-intercept (c) Predict the final exam score for a student who misses five class periods. y= 74.58 (Round to two decimal places as needed.) Compute the residual. - 0.28 (Round to two decimal places as needed.) Is the final exam score above or below average for this number of absences? O Below Above i Reference X Critical Values for Correlation Coefficient n 3 0.997 0.950 5 0.878 6 0.811 7 0.754 8 0.707 9 0.666 10 0.632 11 0.602 12 0.576 13 0.55 14 0.532 15 0.514 16 0.497 17 0.482 18 0.468 19 0.45 20 0.444 21 0.433 22 0.423 Click to select your answer and then click Che 23 0.413 24 0.404 ? 2 parts 25 remaining 0.396 26 0.388 Final Check 27 0.381 28 0.374 29 0.367 30 0.361 11 Print Done O