

Answered step by step
Verified Expert Solution
Question
1 Approved Answer
I need help with the last 3 parts. I do no know how use Label Encoding to convert all categorical features into numerical features Lab
I need help with the last 3 parts. I do no know how use Label Encoding to convert all categorical features into numerical features
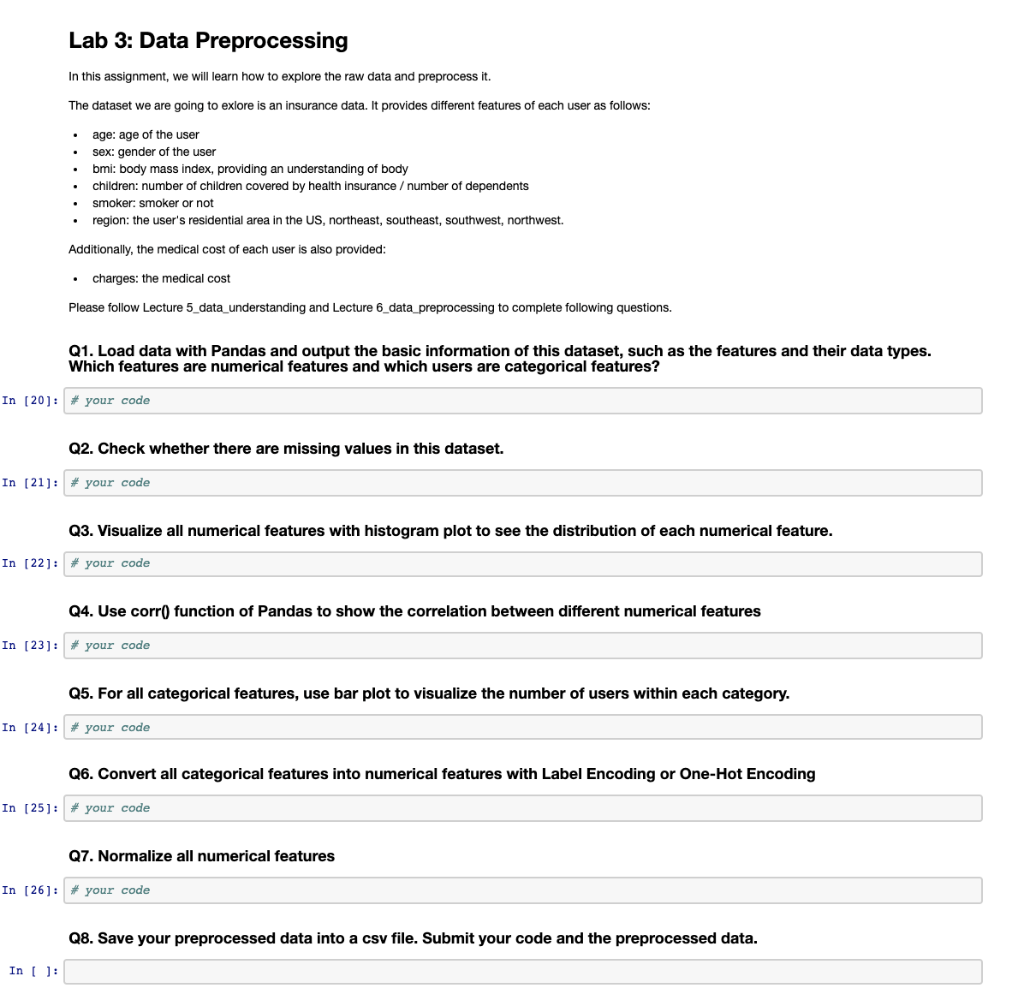
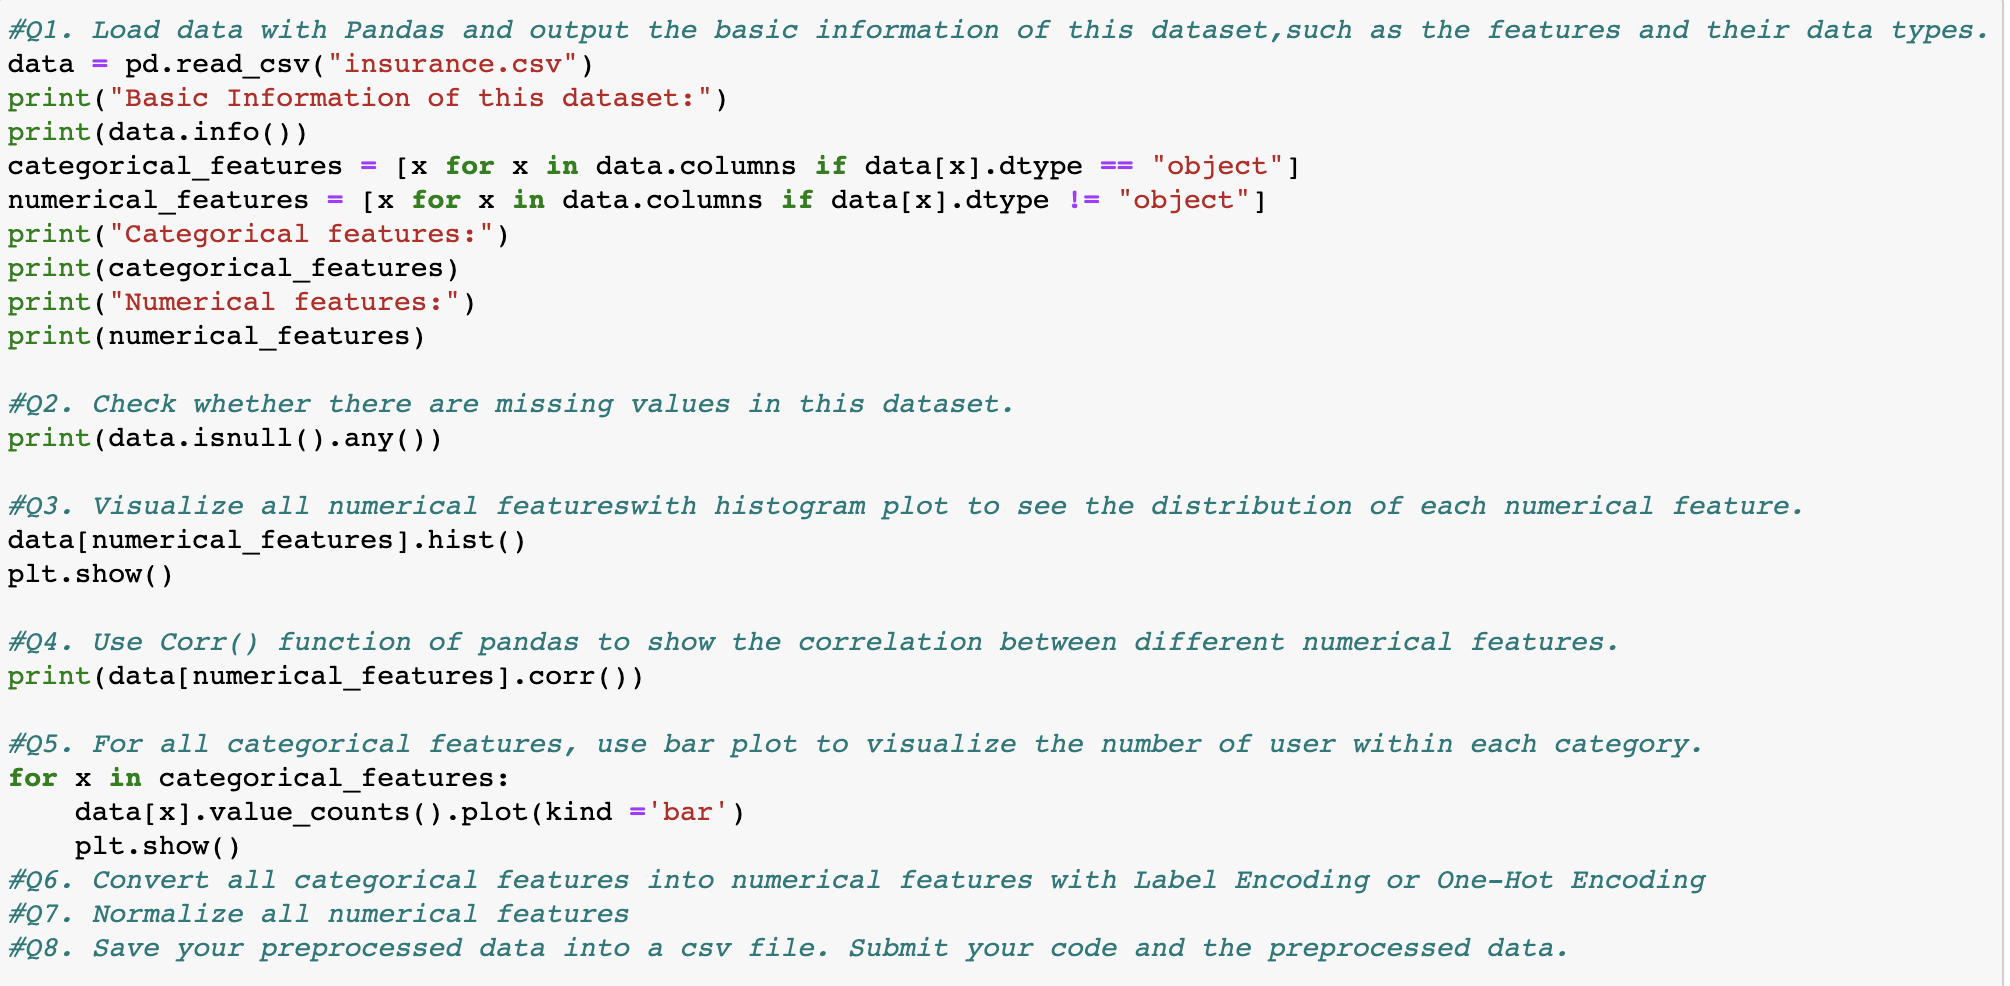
Lab 3: Data Preprocessing In this assignment, we will learn how to explore the raw data and preprocess it. The dataset we are going to exlore is an insurance data. It provides different features of each user as follows: age: age of the user sex: gender of the user bmi: body mass index, providing an understanding of body children: number of children covered by health insurance / number of dependents smoker: smoker or not region: the user's residential area in the US, northeast, southeast, southwest, northwest. Additionally, the medical cost of each user is also provided: . charges: the medical cost Please follow Lecture 5_data_understanding and Lecture 6_data_preprocessing to complete following questions. Q1. Load data with Pandas and output the basic information of this dataset, such as the features and their data types. Which features are numerical features and which users are categorical features? In [20]: your code Q2. Check whether there are missing values in this dataset. In [21]: #your code Q3. Visualize all numerical features with histogram plot to see the distribution of each numerical feature. In [22]: # your code Q4. Use corr() function of Pandas to show the correlation between different numerical features In [23]: your code Q5. For all categorical features, use bar plot to visualize the number of users within each category. In [24]: # your code Q6. Convert all categorical features into numerical features with Label Encoding or One-Hot Encoding In [25]: #your code Q7. Normalize all numerical features In [26]: your code Q8. Save your preprocessed data into a csv file. Submit your code and the preprocessed data. In (): #01. Load data with Pandas and output the basic information of this dataset, such as the features and their data types. data = pd.read_csv("insurance.csv") print("Basic Information of this dataset:") print(data.info() ) categorical_features = [X for x in data.columns if data[x].dtype "object"] numerical_features = [x for x in data.columns if data[x].dtype != "object"] print("Categorical features:") print(categorical_features) print("Numerical features:") print(numerical_features) #92. Check whether there are missing values in this dataset. print(data.isnull().any()) #03. Visualize all numerical featureswith histogram plot to see the distribution of each numerical feature. data[numerical_features].hist() plt.show() #04. Use Corr() function of pandas to show the correlation between different numerical features. print(data[numerical_features].corr( ) ) #05. For all categorical features, use bar plot to visualize the number of user within each category. for x in categorical_features: data[x].value_counts() .plot(kind ='bar') plt.show() #06. Convert all categorical features into numerical features with Label Encoding or One-Hot Encoding #07. Normalize all numerical features #08. Save your preprocessed data into a csv file. Submit your code and the preprocessed dataStep by Step Solution
There are 3 Steps involved in it
Step: 1

Get Instant Access to Expert-Tailored Solutions
See step-by-step solutions with expert insights and AI powered tools for academic success
Step: 2

Step: 3
Ace Your Homework with AI
Get the answers you need in no time with our AI-driven, step-by-step assistance
Get Started
Database Concepts
Authors: David Kroenke, David J. Auer
3rd Edition
0131986252, 978-0131986251