I need help with the questions.
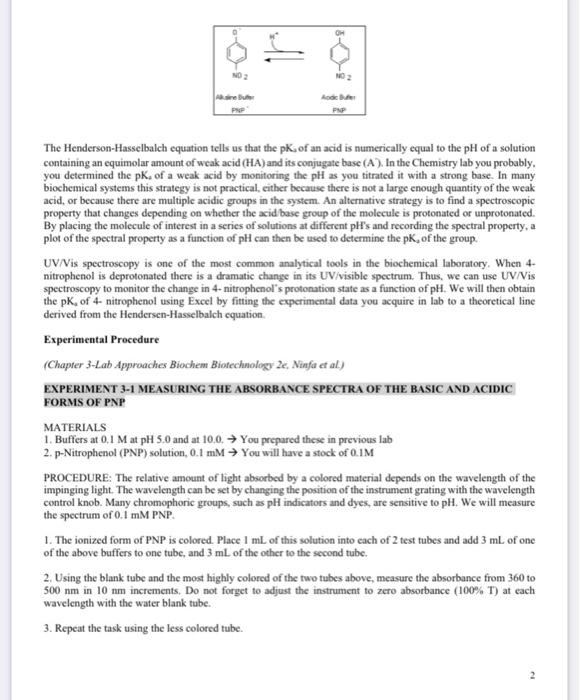
Experiment \#3 Absorbance Spectra, pKa and concentration of p-Nitrophenol (PNP) Objective: Determine the absorbance spectra, pKa and concentration of the phenolic compound, 4-nitrophenol (PNP) using UV/Visible spectroscopy. This experiment will incorporate several important techniques used in the biochemistry laboratory, solution preparation, calibration curve, UV/Visible spectroscopy and data analysis using Excel. Background reading: Ch.3 - Alexander J. Ninfa and David P. Ballou (2010). Fundamental Laboratory Approaches for Biochemistry and Biotechnology. Ch.7 Boyer, Biochemistry Laboratory: Modern Theory and Techniques. Reagents Needed: Buffers at 0.1M at pH 5.0 and at 10.0. Buffers 0.1M at nominal pH values of 5,6,7,7.5,8,8.5,9, and 10 p-Nitrophenol (PNP) solution, 0.1mM Unknown solutions A and B Equipment Needed: Spectrophotometer pH meters Magnetic stirrers Beakers, volumetric flasks Standard volumetric flask Test tubes 5,10ml Background: Spectrophotometry (or colorimetry) is the process that determines the amount of light energy absorbed by colored compounds. It is used for quantitative estimation of compounds based on color intensities and for measuring the identifying spectral properties of molecules and atoms. Many biochemicals are colored; that is, they absorb visible light and thereby can be measured by colorimetric procedures. Even colorless biochemicals can often be converted to colored compounds by chromogenic (color-forming) reactions to yield compounds suitable for colorimetric analysis. In the experiments in the biochemistry lab, you will make use of spectrophotometry often in measurements of enzyme activities, determinations of protein concentrations, determinations of enzymatic kinetic constants, and measurements of ligand-binding reactions. The exercises in this experiment are to familiarize you with the use of spectrophotometry by measuring spectra of compounds, quantifying compounds by their absorbance properties, and using the spectral properties of p-nitrophenol (PNP) to determine its pKa. The relative amount of light absorbed by a colored material depends on the wavelength of the impinging light. The wavelength can be set by changing the position of the instrument grating with the wavelength control knob. Many chromophoric groups, such as pH indicators and dyes, are sensitive to pH. We will measure the spectrum of 0.1mM p-Nitrophenol (PNP). The Henderson-Hasselbalch equation tells us that the pK, of an acid is numerically equal to the pH of a solution containing an equimolar amount of weak acid (HA) and its conjugate base (A). In the Chemistry lab you probably. you determined the pK4 of a weak acid by monitoring the pH as you titrated it with a strong base. In many biochemical systems this strategy is not practical, either because there is not a large enough quantity of the weak acid, or because there are multiple acidic groups in the system. An alternative strategy is to find a spectroscopic property that changes depending on whether the acid base group of the molecule is protonated or unprotonated. By placing the molecule of interest in a series of solutions at different pHs and recording the spectral property, a plot of the spectral property as a function of pH can then be used to determine the pK4 of the group. UVN Vis spectroscopy is one of the most common analytical tools in the biochemical laboratory. When 4nitrophenol is deprotonated there is a dramatic change in its UV/visible spectrum. Thus, we can use UV/Vis spectroscopy to monitor the change in 4-nitrophenol's protonation state as a function of pH. We will then obtain the pK4 of 4- nitrophenol using Excel by fitting the experimental data you acquire in lab to a theoretical line derived from the Hendersen-Hasselbalch equation. Experimental Procedure (Chapter 3-Lab Approaches Biochem Biotechnology 2e, Ninfar et al.) EXPERIMENT 3-1 MEASURING THE ABSORBANCE SPECTRA OF THE BASIC AND ACIDIC FORMS OF PNP MATERIALS 1. Buffers at 0.1M at pH5.0 and at 10.0, You prepared these in previous lab 2. p-Nitrophenol (PNP) solution, 0.1mM You will have a stock of 0.1M PROCEDURE: The relative amount of light absorbed by a colored material depends on the wavelength of the impinging light. The wavelength can be set by changing the position of the instrument grating with the wavelength control knob. Many chromophoric groups, such as pH indicators and dyes, are sensitive to pH. We will measure the spectrum of 0.1mM PNP. 1. The ionized form of PNP is colored. Place 1mL of this solution into cach of 2 test tubes and add 3mL of one of the above buffers to one tube, and 3mL of the other to the second tube. 2. Using the blank tube and the most highly colored of the two tubes above, measure the absorbance from 360 to 500nm in 10nm increments. Do not forget to adjust the instrument to zero absorbance (100% T) at each wavelength with the water blank tube. 3. Repeat the task using the less colored tube. PLOT ABSORBANCE OF PNP VS. WAVELENGTH 4. Plot the absorbance values for each sample vs. wavelength to produce the visible spectra of PNP at pH 5 and 10. These values yield nearly minimum and maximum fractions of the anionic form. Is there a wavelength at which no changes in absorbance occur as the pH is varied? (Such a wavelength would be called an isosbestic point.) Why would the isosbestic point be useful to measure for each of the samples? EXPERIMENT 3-2 DETERMINING THE PKA OF PNP MATERIALS 1. Buffers (0.1M) at nominal pH values of 5,6,7,7.5,8,8.5,9, and 10 You prepared these in previous lab 2. PNP solution, 0.1mM PROCEDURE In Experiment 3-1, you measured the spectra of the ionized and the protonated forms of PNP. Using those results, in this experiment, you will choose a wavelength that is useful to distinguish the protonated and unprotonated forms of PNP. You will use 0.1mM PNP as in Experimen3-1. 1. Place 1mL of this solution into each of 8 test tubes and add 3mL of the above buffers, one to each tube, using the stock buffers above. Two of these tubes should already be made up from Experiment 3-1. You might make them up again and measure their absorbance to determine your experimental precision. 2. Read the absorbance A at the most reasonable wavelength determined from Experiment 3-1, adjusting the Spectronic 200 to zero A with a water blank. 3. Plot the absorbance of PNP vs. the pH. QUESTIONS 3-1 How many micromoles of PNP were placed into each tube? 3-2 Draw the structure of the p-nitrophenolate ion formed in the alkaline buffer. From the plot of A vs. pH, calculate the approximate pKa of the compound 3-3 What is the molar absorptivity of PNP at pH 8.5? Use the Beer- Lambert equation and assume that the path length, 1 , is 1cm. If you use the calculated concentration from above in mM, multiply your answer by 1000 to get the molar value. If you use the M value in the equation, multiply your value by 1,000,000. Remember that the units in the final answer are Lcm1mol1 (L stands for liter). EXPERIMENT 3-3 OPTICAL ASSAY OF PNP In this experiment, you will determine the concentration and amount of PNP in an unknown sample by comparing the absorbance of the sample to the absorbance of standards containing known amounts of PNP. This will be an opportunity to develop a standard curve and to use it for determining an unknown concentration. MATERIALS 1. Standard PNP solution (0.1mM) 2. pH10.0 buffer 3. Unknown PNP solution (A or B) METHOD 1. Dilute the standard PNP solution appropriately with pH10.0 buffer ( 4mL final volume) to make 5 known standards containing 10M,20M,30M,50M and 75MPNP. 2. Measure the Absorbance at the wavelength where PNP absorbs maximally (Amax, which you determined in Experiment 3-2). 3. Dilute 1mL of one of the unknowns with 3mL of buffer, and measure at the same wavelength. RESULTS AND CALCULATIONS - Plot the known concentrations of PNP vs. Amax for the data obtained with the standards. This plot is known as a standard curve. - Read the concentration of the unknown from the standard curve. QUESTIONS 3-4 Why would you want to use the wavelength of maximum absorption for this determination? 3-5 Calculate the amount of PNP in nmol present in each of the above solutions in the 4mL of the diluted PNP solutions 3-6 Calculate the concentration of the unknow PNP solution


