

Question
I need help with the questions shown in the image and (c) Find the sample correlation coefficient r and the coefficient of determination (Round your
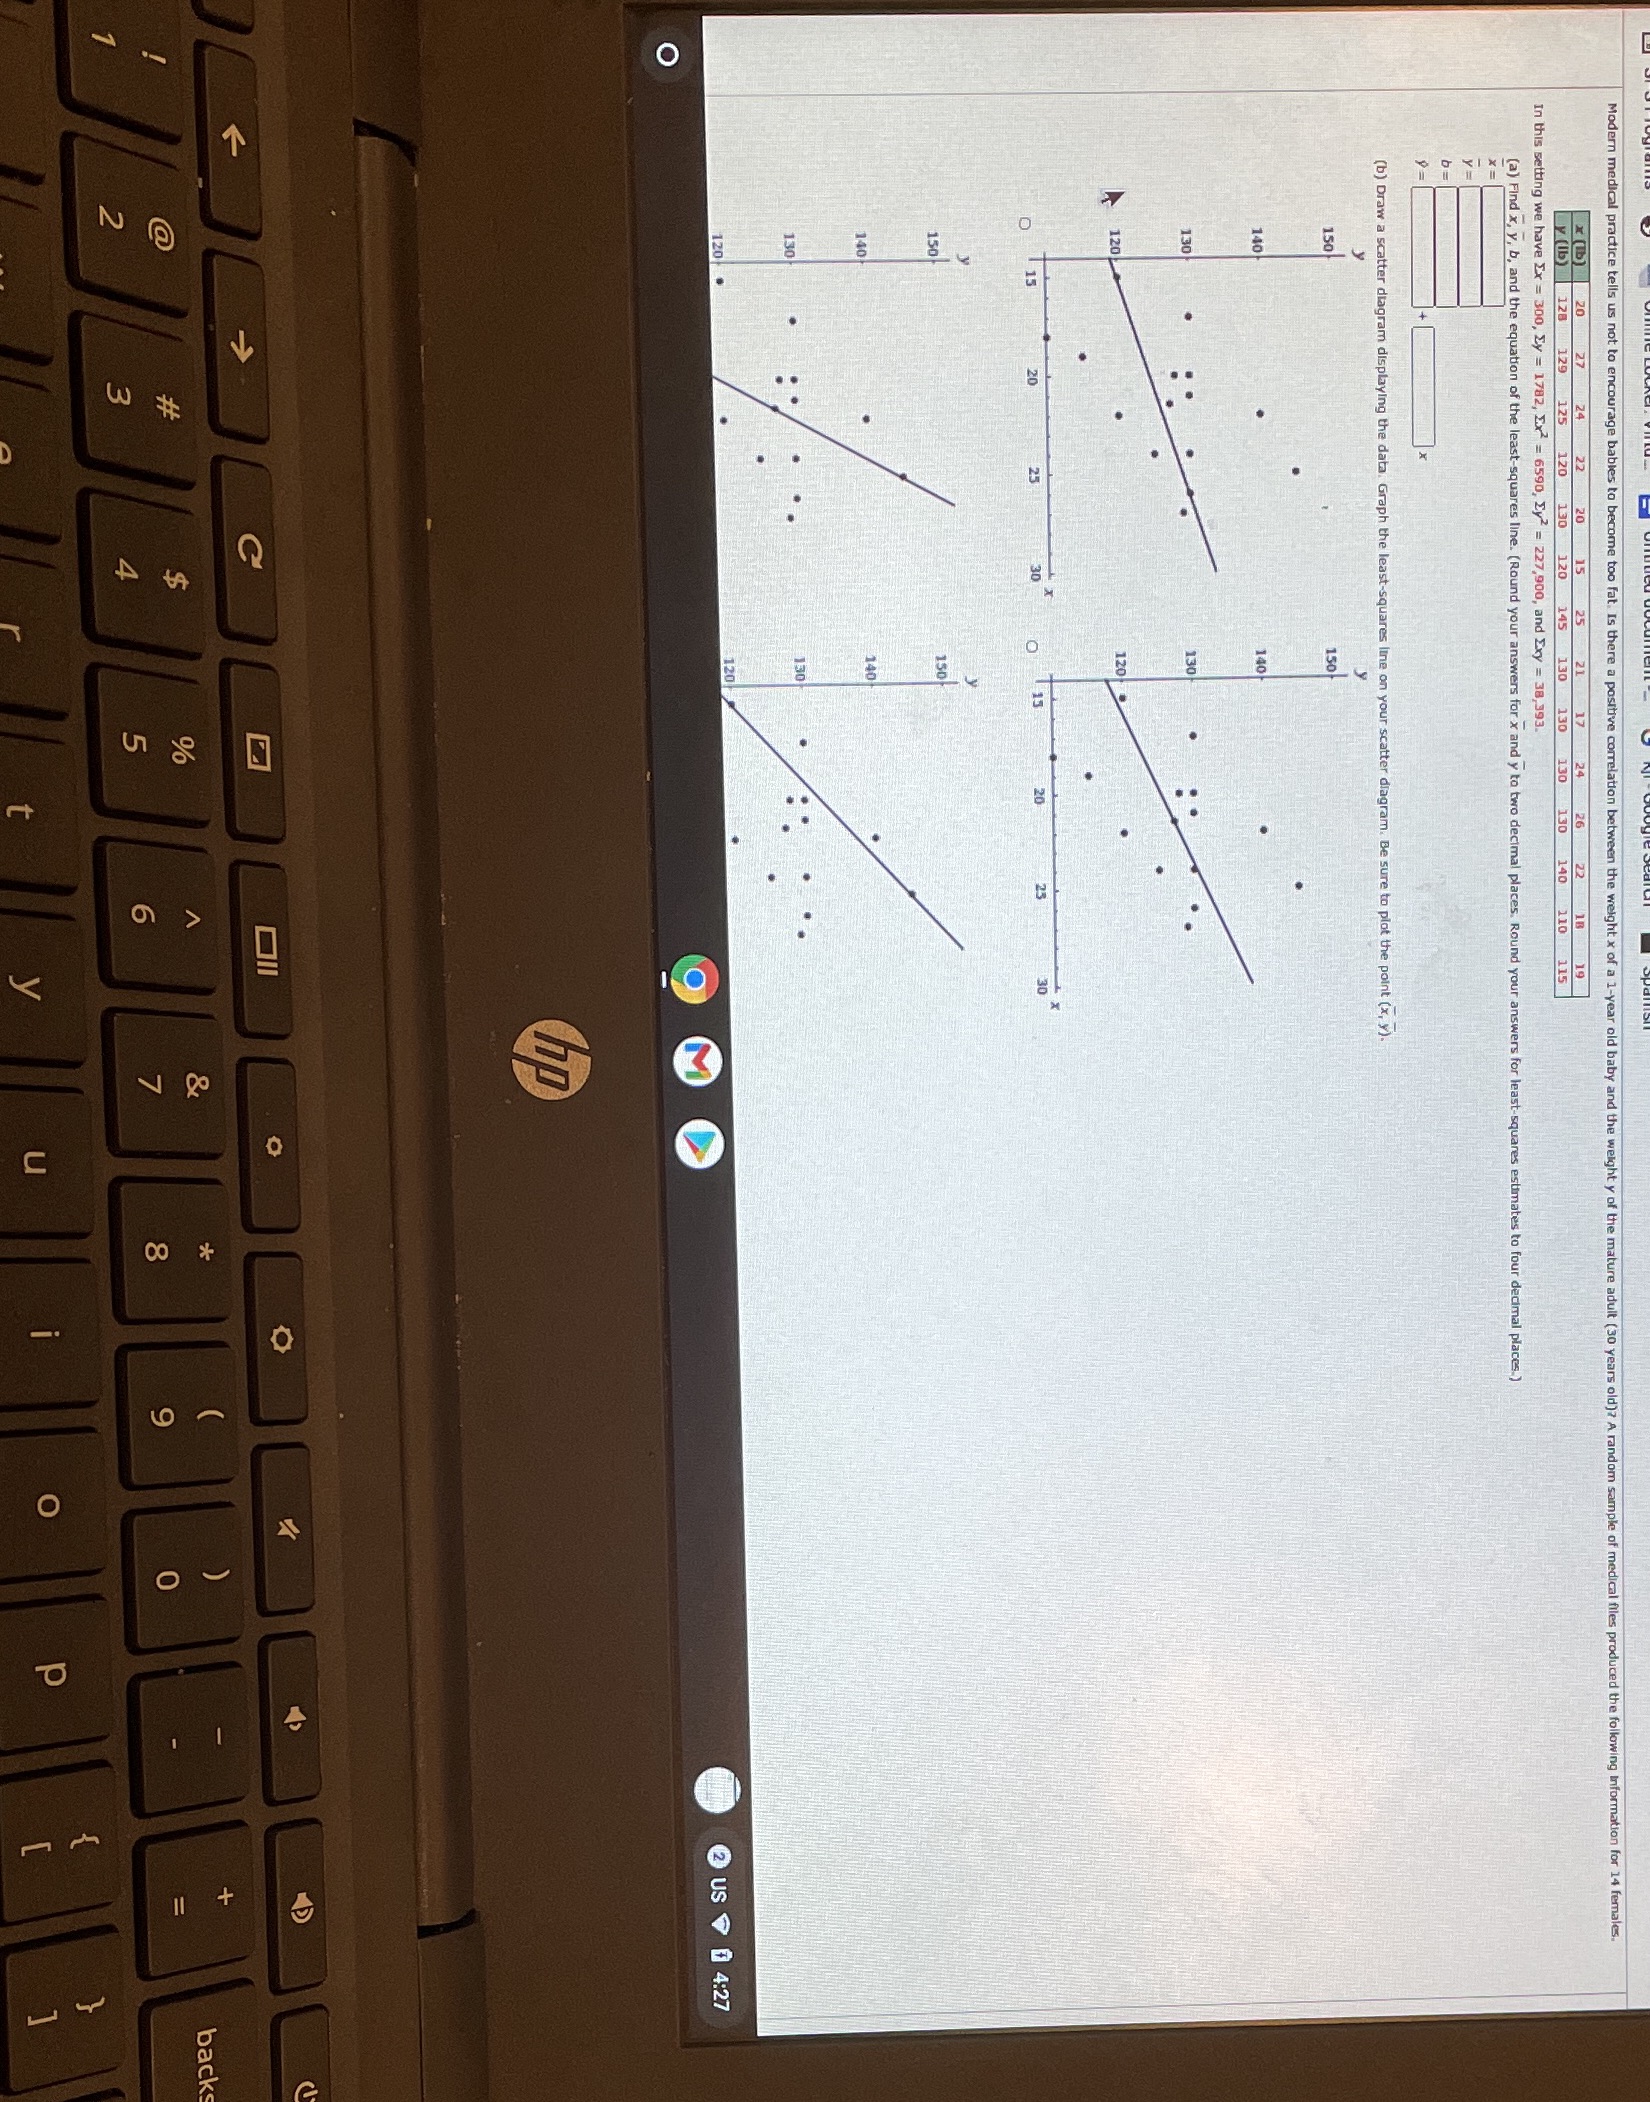
I need help with the questions shown in the image and (c) Find the sample correlation coefficient r and the coefficient of determination (Round your answers to three decimal places)r = __r = ___What percentage of variation in y is explained by the least - squares model? (Round your answer to one decimal place) ___%(d) Test the claim that the population correlation coefficient P is positive at the 1% level of significance (Round your test statistic to three decimal places) t = __Find or estimate the P-value of the test statistic -P-value > 0.250 -0.125 0-Reject the null hypothesis. There is insufficient evidence that P>0-Fail to reject the null hypothesis. There is sufficient evidence that P>0-Fail to reject the null hypothesis. There is insufficient evidence that P>0(e) If a female baby weighs 21 pounds at 1 year, what do you predict she will weigh at 30 years of age? ( Round your answer to two decimal places) ____ Ib (f) Find Se (Round your answer to two decimal places) Se___(g) Find a 95% confidence interval for weight at age 30 of a female who weighed 21 pounds at 1 year of age. (Round your answers to two decimal places) lower limit ___ Ib upper limit ___ Ib(h) test the claim that's the slope B of the population least-squares line is positive at the 1% level of significance (Round your test statistic to three decimal places) t = ___Find or estimate the P-value of the test statistic. -P-value > 0.250 -0.125 0-Reject the null hypothesis. There is insufficient evidence that B>0-Fail to reject the null hypothesis. There is sufficient evidence that B>0-Fail to reject the null hypothesis. There is insufficient evidence that B>0(I) Find an 80% confidence interval for B and interpret its meaning. (Round your answers to three decimal places.) lower limit ___upper limit ___Interpretation - for each pound more a female infant weighs at one year, the adult weight increases by an amount that falls within the confidence interval- for each pound more a female infant weighs at one year, the adult weight increases by an amount that falls outside the confidence interval- for each pound less a female infant weighs at one year, the adult weight increases my amount that falls outside the confidence interval- for each pound less a female infant weighs at one year, the adult weight increases by amount that falls within the confidence interval
Step by Step Solution
There are 3 Steps involved in it
Step: 1

Get Instant Access to Expert-Tailored Solutions
See step-by-step solutions with expert insights and AI powered tools for academic success
Step: 2

Step: 3
Ace Your Homework with AI
Get the answers you need in no time with our AI-driven, step-by-step assistance
Get Started
An Introduction to the Mathematics of financial Derivatives
Authors: Salih N. Neftci
2nd Edition
978-0125153928, 9780080478647, 125153929, 978-0123846822