I need help with these question! I don't understand how to do them. STAT 200 Week 7 Homework Problems 4.7 42.5 2.6 47.9 10.1.2 4.8
I need help with these question! I don't understand how to do them.
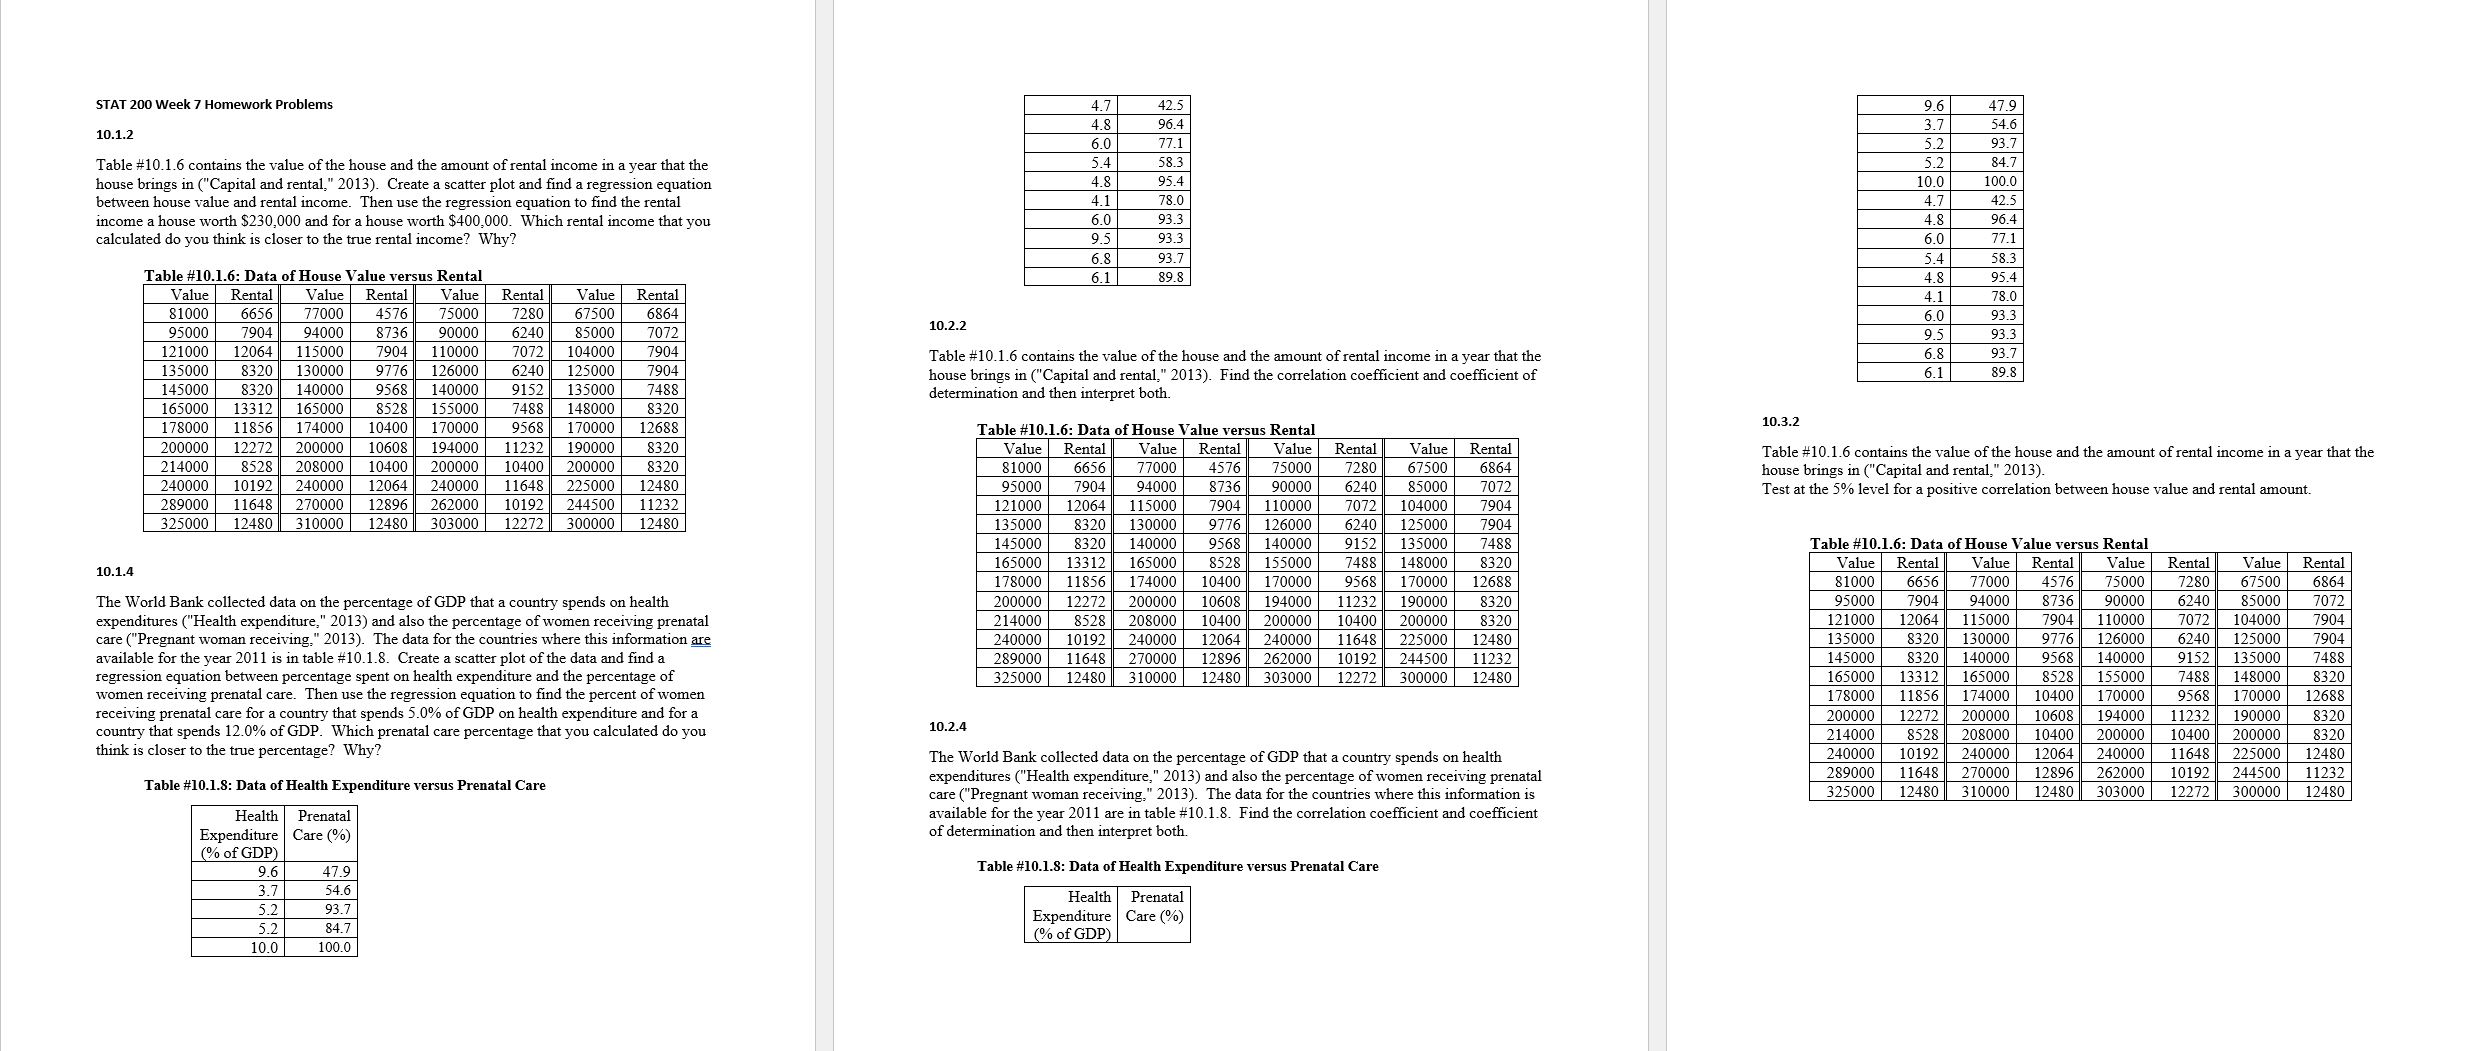
STAT 200 Week 7 Homework Problems 4.7 42.5 2.6 47.9 10.1.2 4.8 96.4 77.1 54.6 6.0 3.7 93.7 Table #10.1.6 contains the value of the house and the amount of rental income in a year that the 5.4 58.3 84.7 house brings in ("Capital and rental," 2013). Create a scatter plot and find a regression equation 4.8 95.4 between house value and rental income. Then use the regression equation to find the rental 4.1 10.0 100.0 78.0 income a house worth $230,000 and for a house worth $400,000. Which rental income that you 4.7 6.0 42.5 93.3 alculated do you think is closer to the true rental income? Why? 96.4 9.5 4. 93.3 6.0 6.8 77.1 93.7 Table #10.1.6: Data of House Value versus Rental 6.1 5.4 58.3 Value Rental 89.8 Value Rental Value Rental Value Rental 4.8 95.4 81000 6656 77000 4576 75000 7280 67500 6864 4.1 78.0 95000 7904 94000 $736 90000 6240 85000 072 10.2.2 6.0 93.3 121000 12064 115000 7904 110000 104000 7904 9.5 93.3 135000 8320 130000 $776 126000 6240 125000 Table #10.1.6 contains the value of the house and the amount of rental income in a year that the 6.8 93.7 1904 145000 8320 140000 9568 140000 9152 135000 7488 house brings in ("Capital and rental," 2013). Find the correlation coefficient and coefficient of 6.1 89.8 165000 13312 165000 8528 155000 7488 148000 determination and then interpret both. 8320 178000 11856 174000 10400 170000 9568 170000 12688 10.3.2 200000 12272 200000 11232 190000 Table #10.1.6: Data of House Value versus Rental 10608 194000 8320 Value Rental 214000 8528 208000 10400 Value Rental 10400 200000 Value Rental 200000 Value Rental 8320 81000 6656 240000 10192 240000 77000 4576 75000 12064 225000 7280 Table #10.1.6 contains the value of the house and the amount of rental income in a year that the 240000 11648 67500 6864 12480 95000 7904 94000 house brings in ("Capital and rental," 2013) 289000 11648 8736 90000 6240 270000 12896 262000 85000 10192 244500 11232 7072 121000 12064 115000 7904 110000 7072 325000 12480 310000 104000 Test at the 5% level for a positive correlation between house value and rental amount. 7904 12480 303000 12272 300000 12480 135000 8320 130000 9776 126000 6240 125000 7904 145000 8320 140000 9568 140000 9152 135000 7488 Table #10.1.6: Data of House Value versus Rental 10.1.4 165000 3312 165000 8528 135000 7488 148000 8320 Value Rental Value Rental Value 178000 11856 Rental Value Rental 174000 10400 170000 9568 170000 12688 The World Bank collected data on the percentage of GDP that a country spends on health 81000 6656 77000 4576 75000 7280 200000 12272 67500 6864 200000 10608 194000 11232 190000 8320 7904 expenditures ("Health expenditure," 2013) and also the percentage of women receiving prenatal 95000 94000 90000 6240 85000 7072 214000 8528 208000 10400 200000 10400 200000 8320 care ("Pregnant woman receiving," 2013). The data for the countries where this information are 121000 12064 115000 7904 110000 072 7904 240000 10192 240000 104000 12064 available for the year 2011 is in table #10.1.8. Create a scatter plot of the data and find a 240000 11648 225000 12480 135000 8320 130000 9776 126000 289000 11648 270000 12896 240 125000 7904 262000 10192 244500 regression equation between percentage spent on health expenditure and the percentage of 11232 145000 8320 140000 9568 140000 9152 135000 7488 women receiving prenatal care. Then use the regression equation to find the percent of women 325000 12480 310000 12480 303000 12272 300000 12480 165000 13312 165000 8528 155000 7488 148000 8320 receiving prenatal care for a country that spends 5.0% of GDP on health expenditure and for a 178000 11856 174000 10400 170000 9568 170000 2688 country that spends 12.0% of GDP. Which prenatal care percentage that you calculated do you 10.2.4 200000 12272 200000 10808 194000 11232 190000 8320 think is closer to the true percentage? Why? 214000 8528 208000 10400 200000 10400 200000 8320 The World Bank collected data on the percentage of GDP that a country spends on health 240000 10192 240000 12064 240000 11648 225000 12480 Table #10.1.8: Data of Health Expenditure versus Prenatal Care expenditures ("Health expenditure," 2013) and also the percentage of women receiving prenatal 289000 11648 270000 12896 262000 10192 244500 11232 care ("Pregnant woman receiving," 2013). The data for the countries where this information is 325000 12480 310000 12480 303000 12272 Health Prenatal 300000 12480 available for the year 2011 are in table #10.1.8. Find the correlation coefficient and coefficient Expenditure Care (%) of determination and then interpret both. (% of GDP) 9.6 47.9 Table #10.1.8: Data of Health Expenditure versus Prenatal Care 3.7 54.6 5.2 93.7 Health Prenatal 5.2 84.7 Expenditure Care (% 10.0 100.0 (% of GDP)
Step by Step Solution
There are 3 Steps involved in it
Step: 1
Get Instant Access to Expert-Tailored Solutions
See step-by-step solutions with expert insights and AI powered tools for academic success
Step: 2
Step: 3
Ace Your Homework with AI
Get the answers you need in no time with our AI-driven, step-by-step assistance