Question
I need help with these questions please- can you show me how to find each answer? I want to make sure I understand. Thank you!
I need help with these questions please- can you show me how to find each answer? I want to make sure I understand. Thank you!
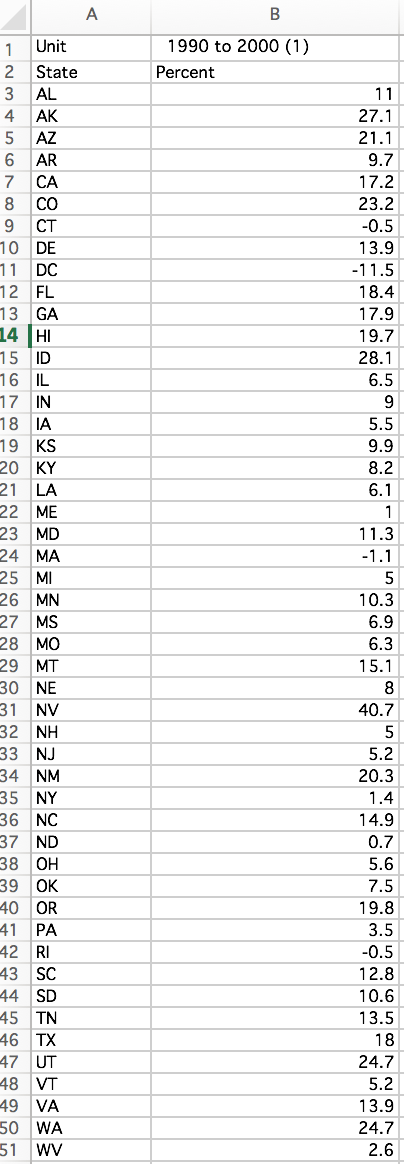
You are to use the Statistical Abstract Data Set for this project.Data sets may be found in the "Data Set" folder in the "Learning Units" tab on our blackboard site.
** For this project, assume that the population is normally distributed ***
Section I
Calculate the mean and standard deviation for the variable:
"population increase by state from 1990 to 2000" (row 10 in the excel file)
Using the normal distribution process, calculate the following probabilities:
(a) a state will have a population decrease,
(b) a state will have a population increase between 10 and 15 percent, and
(c) a state will have a population increase of more than 20 percent.
Section II
Select a random sample of 20 states from the data set.List the states selected along with their population increase for each state.How many of the states in your sample had a population decrease, an increase between 10 and 15%, and an increase of greater than 20%. Based on the calculations you performed in Section I, are the numbers in each category which you found in your sample what you would expect?Why or why not?
Section III
Using the normal distribution process for a distribution of sample means, calculate the following probabilities for the average of a randomly selected sample of 5 states:(do not take an actual sample for this section):
(a) The average population decreases,
(b) the average population increases between 10 and 15 percent, and
(c) the average population increases by more than 20 percent.
Section IV
Select 20 different random samples of 5 states from the data set.List the state and population increase for each of your 20 samples.Find the mean population increase for each of your 20 samples and list those means.How many of these means showedc a population decrease, an increase between 10 and 15%, and an increase of greater than 20%. Based on the calculations you performed in Section III, are the values you found for your sample what you would expect?Why or why not?
Section V.
Please construct a binomial probability distribution where a success is defined as a state having greater than 20% population increase from 1990 to 2000.What would P(success) and P(failure) be based on your previous calculations?Calculate the expected number of states which would have greater than 20% population increase from a random sample of 20 states.How does this expected number match with what you actually found in your particular sample of 20 (Section II)?Depending on your answer, why do you think these values are the same or different?
Calculate the expected number states with greater than 20% population increase in a random sample of 5 states.How many states (in of a sample of 5) would it be unusual to find to have greater than 20% population increase?Count the number of states with over 20% population increase in each of your 20 samples of 5.Are any of these numbers unusual?Calculate the average number of states with greater than 20% increase in your 20 samples of 5?Compare this to the expected number. Depending on your answer, why do you think these values are the same or different?
If you have any questions about this assignment, please let me know. The best format to ask questions will be on the discussion boards on Blackboard, for that way the entire class can benefit from the questions and answers.
Your project should be turned in to me in a neat format.50% of your grade will come from the calculations and graphs you have, and 50% will be based on how well you address the questions posed in the assignment.


Step by Step Solution
There are 3 Steps involved in it
Step: 1

Get Instant Access to Expert-Tailored Solutions
See step-by-step solutions with expert insights and AI powered tools for academic success
Step: 2

Step: 3

Ace Your Homework with AI
Get the answers you need in no time with our AI-driven, step-by-step assistance
Get Started


