Answered step by step
Verified Expert Solution
Link Copied!

Question

1 Approved Answer

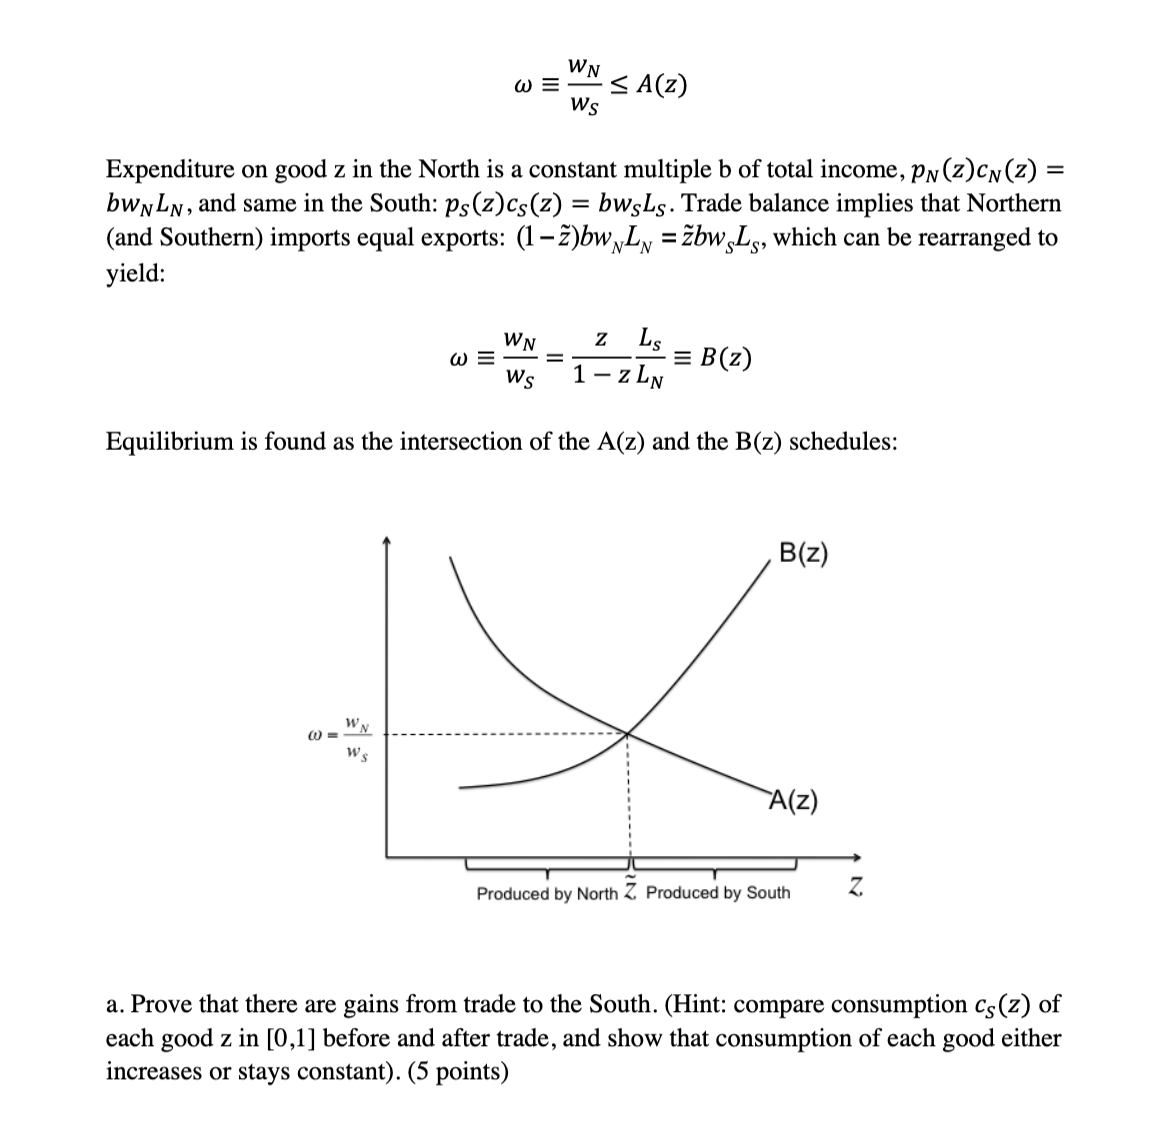
I need help with these questions Question 4. Consider the DornbuschFischer-Samuelson model. There are two countries, North and South, and a continuum of goods indexed

I need help with these questions
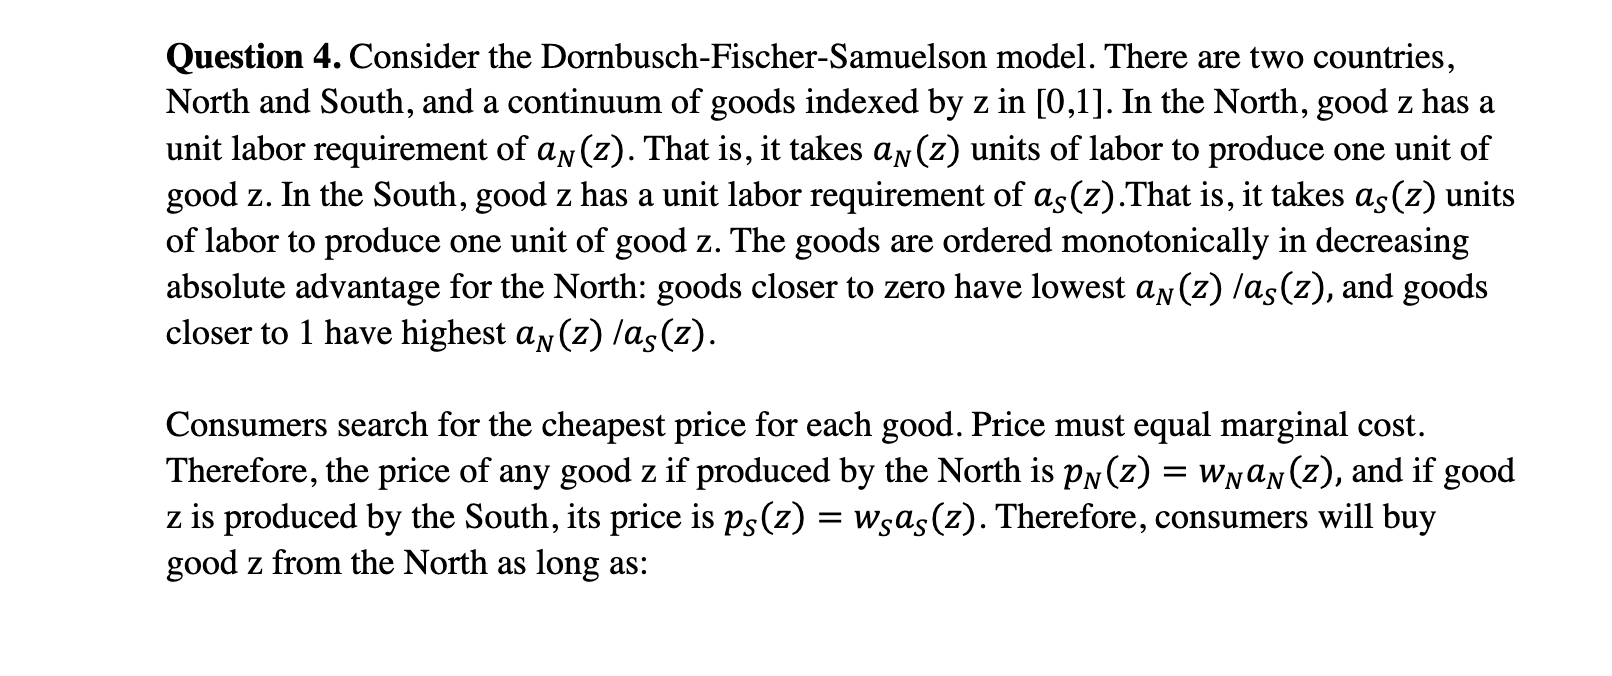
image text in transcribedimage text in transcribedimage text in transcribed
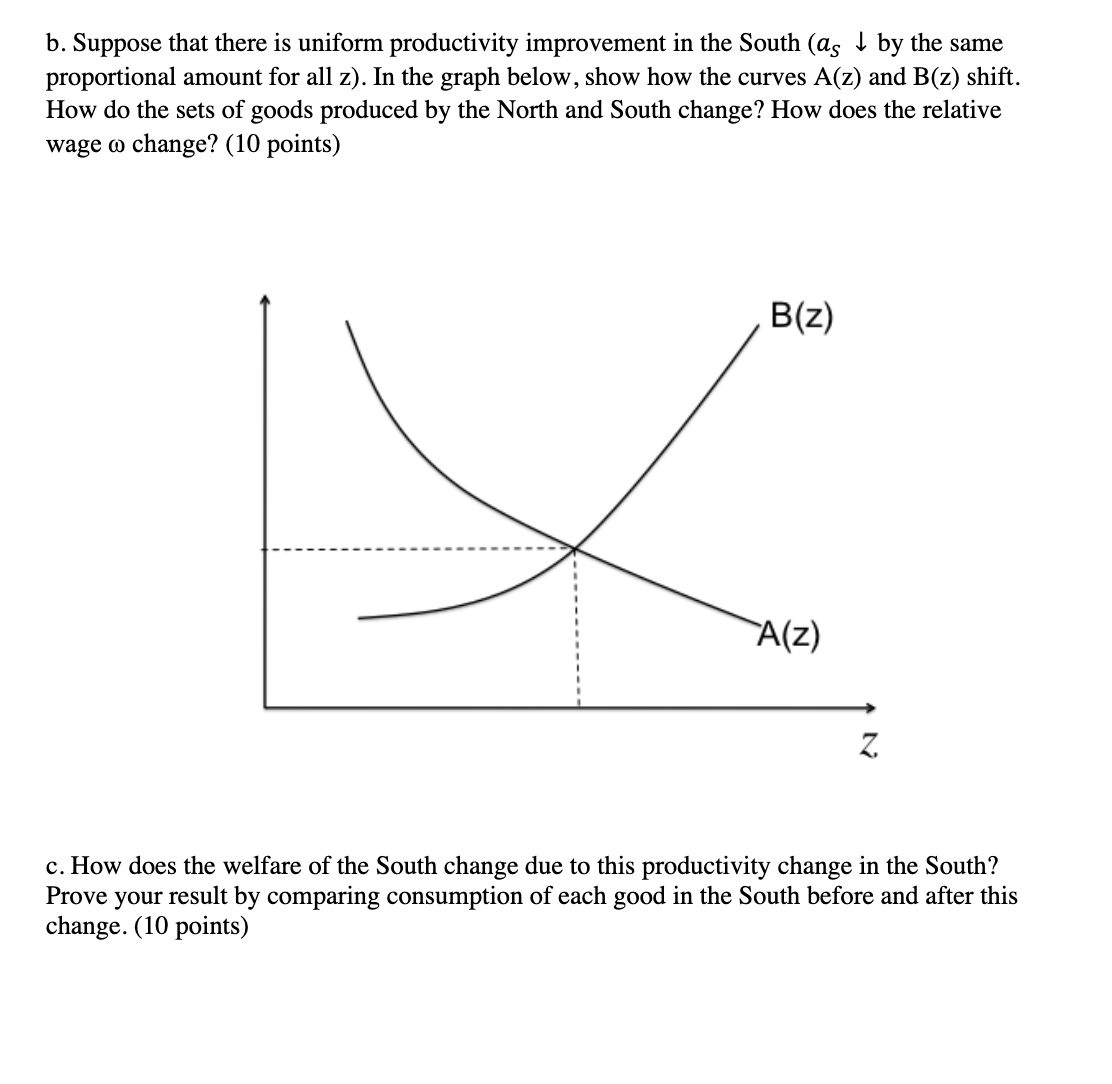
Question 4. Consider the DornbuschFischer-Samuelson model. There are two countries, North and South, and a continuum of goods indexed by z in [0,1]. In the North, good 2 has a unit labor requirement of mu (2). That is, it takes aN (2) units of labor to produce one unit of good 2. In the South, good 2 has a unit labor requirement of (13(2) .That is, it takes (13(2) units of labor to produce one unit of good 2. The goods are ordered monotonically in decreasing absolute advantage for the North: goods closer to zero have lowest (1\" (z) la5(z), and goods closer to 1 have highest :1\" (2) las (2). Consumers search for the cheapest price for each good. Price must equal marginal cost. Therefore, the price of any good 2 if produced by the North is p N (z) = W\" (IN (2), and if good 2 is produced by the South, its price is 135(2) = was (2). Therefore, consumers will buy good 2 from the North as long as: WN E S A a) W3 (2) Expenditure on good z in the North is a constant multiple b of total income, gm (2) CN (2) = waLN, and same in the South: p5 (z)cs(z) = waLS. Trade balance implies that Northern (and Southern) imports equal exports: (1 )waLN = EbwyLS, which can be rearranged to yield: _wN_ 2 L5_ wWS1_ZLNB(ZJ Equilibrium is found as the intersection of the A(z) and the B(z) schedules: Produced by North Z Produced by South Z a. Prove that there are gains from trade to the South. (Hint: compare consumption c5 (2) of each good 2 in [0,1] before and after trade, and show that consumption of each good either increases or stays constant). (5 points) b. Suppose that there is uniform productivity improvement in the South (as ) by the same proportional amount for all z). In the graph below, show how the curves A(z) and B(z) shift. How do the sets of goods produced by the North and South change? How does the relative wage w change? (10 points) B(Z) A(Z) c. How does the welfare of the South change due to this productivity change in the South? Prove your result by comparing consumption of each good in the South before and after this change. (10 points)

Step by Step Solution

There are 3 Steps involved in it

Step: 1

blur-text-image

Get Instant Access to Expert-Tailored Solutions

See step-by-step solutions with expert insights and AI powered tools for academic success

Step: 2

blur-text-image

Step: 3

blur-text-image

Ace Your Homework with AI

Get the answers you need in no time with our AI-driven, step-by-step assistance

Get Started

Recommended Textbook for

International economics

Authors: Robert J. Carbaugh

13th Edition

978-1439038949, 1439038945, 978-8131518823

More Books

Students also viewed these Economics questions

Question

LO3.2 Describe demand and explain how it can change.

Answered: 1 week ago