i need help with these questions thank you in advance
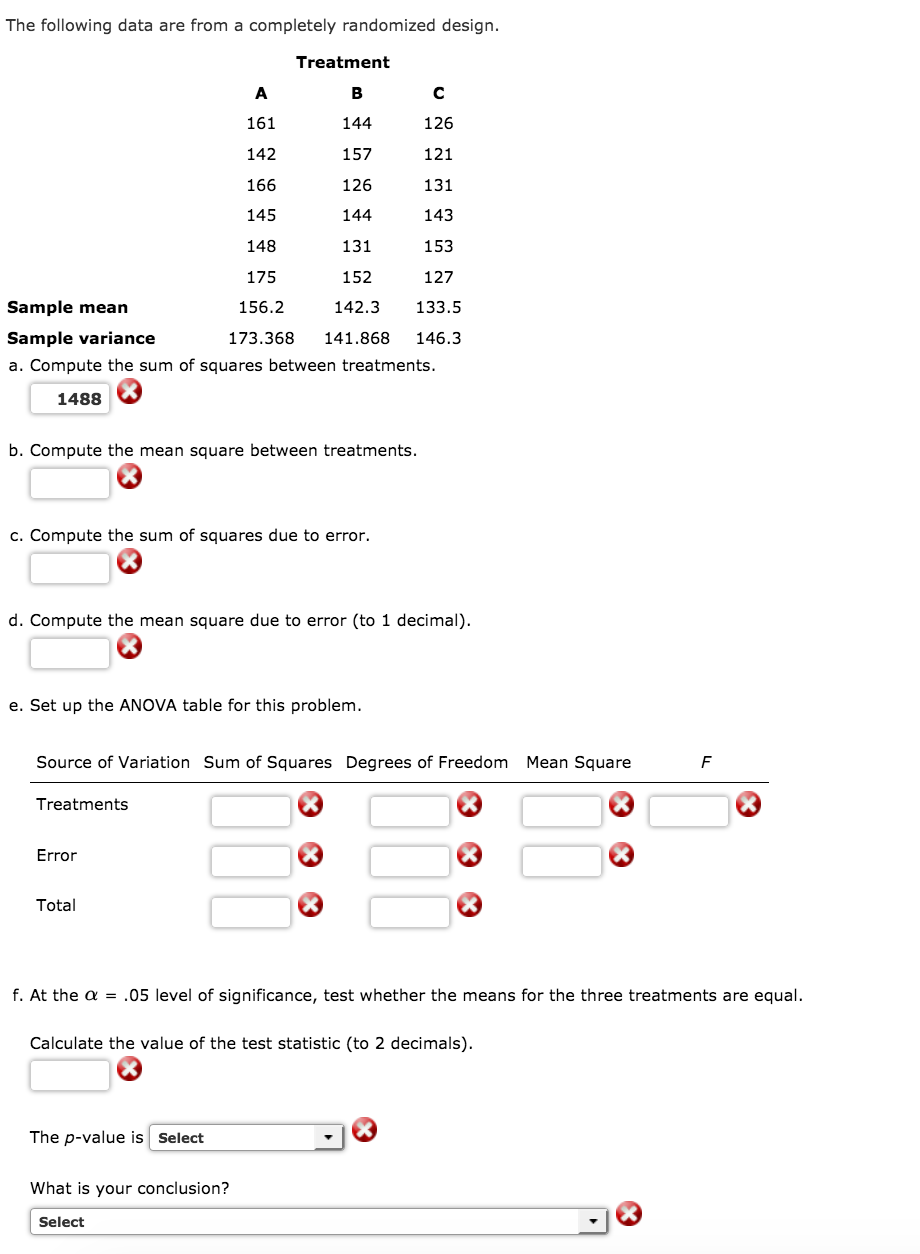
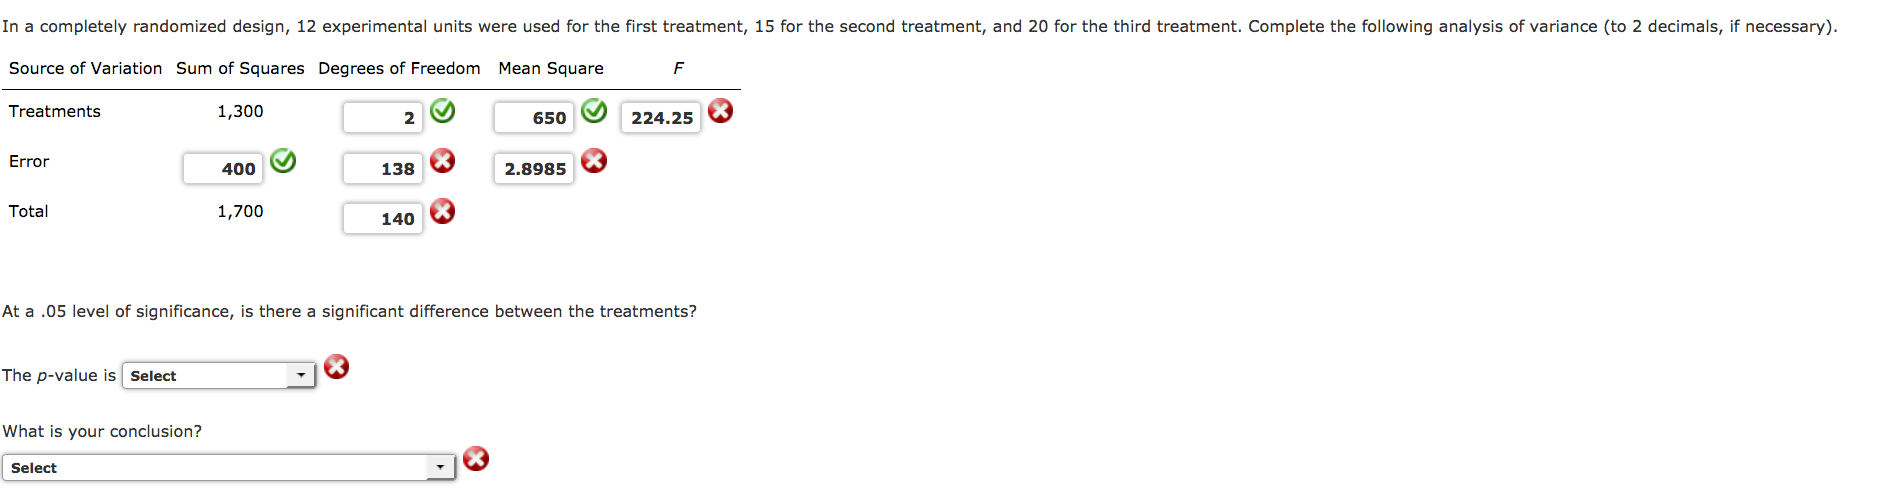
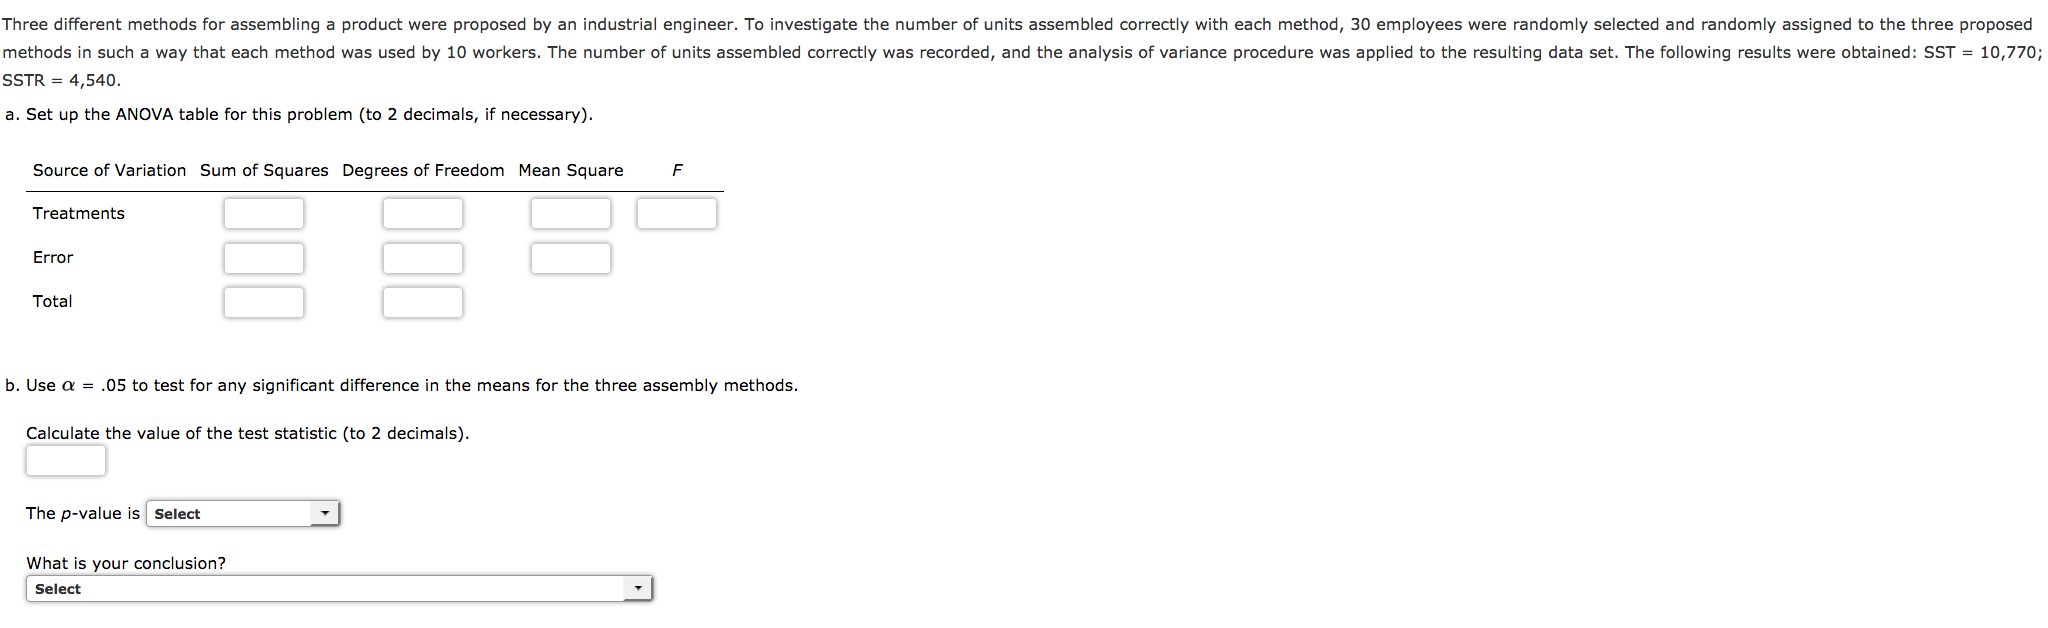
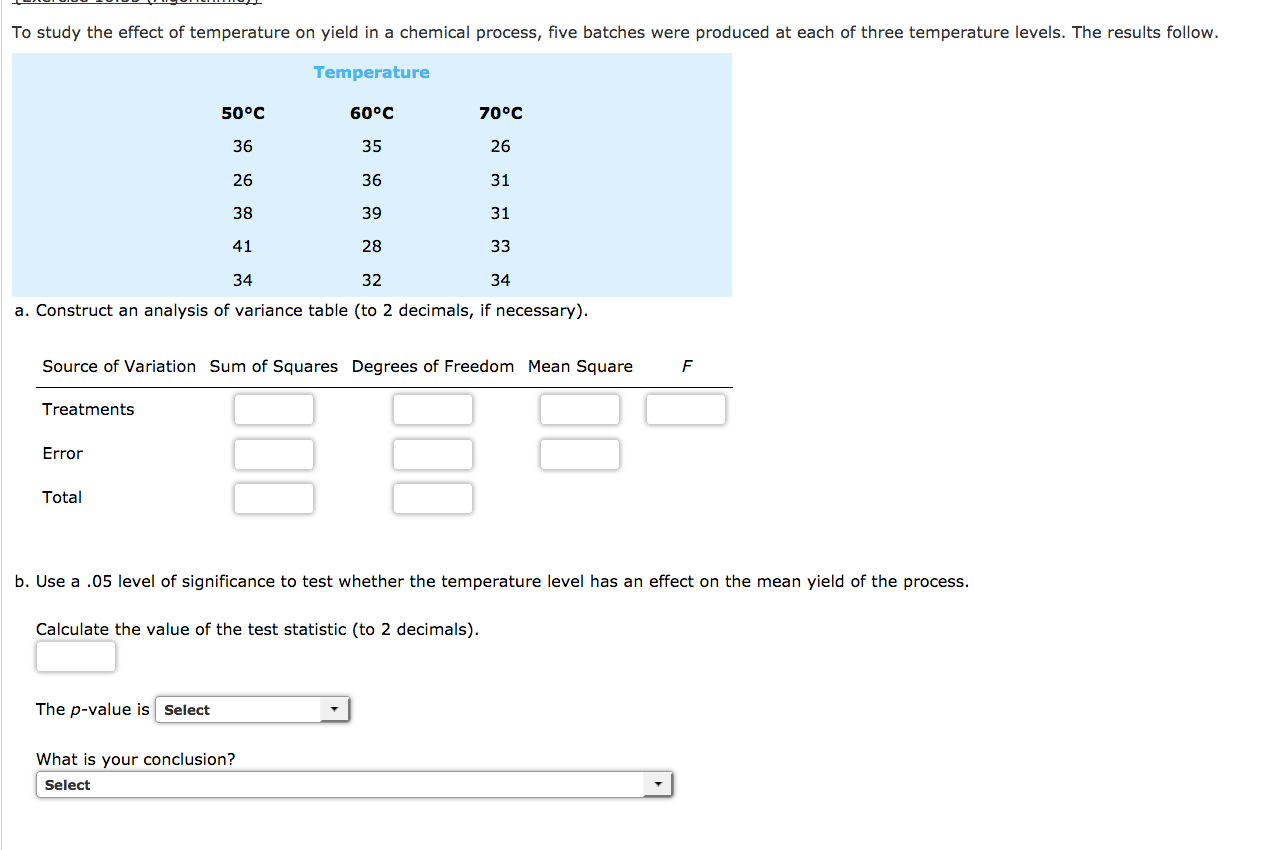
The following data are from a completely randomized design. Treatment A B C 161 144 126 142 157 121 166 126 131 145 144 143 148 131 153 175 152 127 Sample mean 156.2 142.3 133.5 Sample variance 173.368 141.868 146.3 a. Compute the sum of squares between treatments. 14cc: 0 b. Compute the mean square between treatments. c. Compute the sum of squares due to error. d. Compute the mean square due to error (to 1 decimal}. e. Set up the ANOVA table for this problem. Source of Variation Sum of Squares Degrees of Freedom Mean Square F Treatments ' Q ' Q ' Q ' Q Ermr . 0 -. a I. a _ Total - :0 I 8 - f. At the o: = .05 level of signicance, test whether the means for the three treatments are equal. Calculate the value of the test statistic (to 2 decimals). . o Thermea What is your conclusion? Select ;| 6 In a completely randomized design, 12 experimental units were used for the rst treatment, 15 for the second treatment, and 20 for the third treatment. Complete the following analysis of variance (to 2 decimals, if necessary). Source ofVariation Sum aquuares Degrees of Freedom Mean Square F Treatments 1,300 2 CO 650 9 224.25 0 Em\" 400 Q 135 0 2.5955 0 Total 1,700 no 6 At a 415 level of signicance, is there a signicant difference between the treatments? Them.50 What is your conclusion? Select LI 0 Three different methods for assembling a product were proposed by an industrial engineer. To investigate the number of units assembled correctly with each method, 30 employees were randomly selected and randomly assigned to the three proposed methods in such a way that each method was used by 10 workers. The number of units assembled correctly was recorded, and the analysis of variance procedure was applied to the resulting data set. The following results were obtained: SSI' : 10,770; SSTR : 4,540. a. Set up the ANDVA table for this problem (to 2 decimals, if necessary). Source of Variation Sum of Squares Degrees of Freedom Mean Square F Treatm ents Error Total b. Use a = .05 to test for any signicant difference in the means for the three assembly methods. Calculate the value of the test statistic (to 2 decimals), What is your conclusion? | select _| To study the effect of temperature on yield in a chemical prooess, ve batches were produced at each of three temperature levels. The results follow. Temperature 50C 60C 70C 36 35 26 25 36 31 3E 39 31 41 28 33 34 32 34 a. Construct an analysis of variance table (to 2 decimals, if necessary). Source of Variation Sum of Squares Degrees of Freedom Mean Square F Treatments Error Total in. Use a .05 level of signicance to test whether the temperature level has an effect on the mean yield of the process. Calculate the value of the test statistic (to 2 decimals). The.-...._ What is your conclusion? Select Ll The following data are from a completely randomized deslgn. Treatment A B C 161 144 126 142 1 5 I" 12 1 166 126 131 145 144 143 148 131 153 175 152 12? Sample mean 156.2 142.3 133.5 Sample varlanee 173.368 141.868 146.3 a. Compute the sum of squares between treatments. | 1566 | 0 b. Compute the mean square between treatments. | 783 | 9 c. Compute the sum of squares due to error. | 2307.5. | 9 d. Compute the mean square due to error (to 1 decimal). | 153.5 | ('3 e. Set up the ANDVA table for this problem. Source of Variation Sum of Squares Degree; of Freedom Mean Square F Treatmenm l1566.3; I 0 | 2 | ('2' | 783.16- | o | 5.09 I ('3 Em\" | 2302.6 | ('3 | 15 | 9 1 153.34- | 9 \"3\"" I 3814 | 0 | 17 | 9 1'. At the a = .05 level of signicance, test whether the means for the three treatments are equal. Calculate the value of the best statlstic (to 2 decimals). 5.09 | ('3 manna:59 What is your conclusion? conclude that the mean: for all three Ira-unannou- not equal v I @ rrlree dlrrererll memes for assemhllng a predm were prdadsed by an lnduslal engineer. Tu lnvestlgzle the memaer el units assemaled correctly wltrl eael. method, an empluvees were randumly selected and randomly asslgned 1d are mree pmpused methods in such a way that eael. melndd was used by 10 markers. The number or emu 10,770; ssrla 4,540. assemaled mneeuy was reedrdea, and the analysls or varlance procedure was applled to the resulurrg data 521.The lelldwmg reruns were dalalned: ssr a. set up we AMOVA table For mls arealerrl (In 2 decimals, lf necessary). source of vanarlml sum of Swans Degrees cl Freedom Mean Square F "mm ll 9 l:' 0 IEl 8 lEl 0 lElQ lilo IE\"? 79"\" l um l 9 l 29 l 9 a. use a a .n5 to am ler any s "lunar\" alfrerellce lrl me means For me mree aseerrlaly memods. calculate the value nfme test sla rm (to 2 aaclmals). l s :2 l 0 \"en-value Is 9 What ls your cancluslnn? mesa. .... .ll ........ ensue... mall mama. ... ..... l v @ To study the effect of temperature on yield in a chemical process, ve batches were produced at each of three temperature levels. The results follow. Temperature 50C 60C 70C 36 35 26 26 36 31 38 39 31 41 28 33 34 32 34 a. Construct an analysis of variance table (to 2 decimals, if necessary). Source of Variation Sum of Squares Degrees of Freedom Mean Square F Treatments 'E' 9 ':' 9 'E' a '3' 0 iEiQ ij iEiG Total 'E' o '3' g b. Use a .05 level of signicance to test whether the temperature level has an effect on the mean yield of the process. Calculate the value of the test statistic (to 2 decimals). ii *3 The p-value is greater than .10 v Q What is your conclusion? I Do not reject the assumption that the mean yields for the three temperatures are equal LI @ The following data are from a completely randomized design. Treatment A B C 161 144 126 142 157 121 166 126 131 145 144 143 148 131 153 175 152 127 Sample mean 156.2 142.3 133.5 Sample variance 173.368 141.868 146.3 a. Compute the sum of squares between treatments. 1566 0 b. Compute the mean square between treatments. 783 0 c. Compute the sum of squares due to error. 2307.5 9 d. Compute the mean square due to error (to 1 decimal). 153.8 9 e. Set up the ANOVA table for this problem. Source of Variation Sum of Squares Degrees of Freedom Mean Square F Treatments 1566.3: 0 2 @ Em" 2307.61 9 15 @ TOE" 3874 0 17 9 783.161 0 153.84: 9 5.09 The following data are from a completely randomized design. Treatment A B C 161 144 126 142 157 121 166 126 131 145 144 143 148 131 153 175 152 127 Sample mean 156.2 142.3 133.5 Sample variance 173.368 141.868 146.3 a. Compute the sum of squares between treatments. 1566.3: 0 b. Compute the mean square between treatments. 783.17 0 c. Compute the sum of squares due to error. 2307.6! 9 cl. Compute the mean square due to error (to 1 decimal). 153.8 9 e. Set up the ANOVA table for this problem. Source of Variation Sum of Squares Degrees of Freedom Mean Square F Treatments 1566.3: 0 2 @ Em\" 2307.61 0 15 @ Tm" 3874 9 I 17 9 783.161 0 153.84- 9 5.09 9 ital J._ll_ J.l_l Sample mean 156.2 142.3 133.5 Sample variance 173.368 141.363 146.3 3. Compute the sum of squares between treatments. 1571.8l 0 b. Compute the mean square between treatments. 785.94 9 c. Compute the sum of squares due to error. 2307.6 9 d. Compute the mean square due to error (to 1 decimal). 153.8 9 e. Set up the ANOVA table for this problem. Source of Variation Sum of Squares Degrees of Freedom Mean Square F Treatments 15713; 0 2 9 785.94 9 5.09 9 Elm" 2307.61 9 15 @ 153.84- @ Total 3879.5- 17 @ f. At the o: = .05 level of signicance, test whether the means for the three treatments are equal. Calculate the value of the test statistic (to 2 decimals). 5.09 9 The pvalue is between .01 and .025 v