I need help with this assigment. python pls.
In this assignment, you will write a Python program that will read in a set of 2D (x, y) points and, using a distance-based criterion, assign each point to a cluster. The criterion for deciding whether any two points belong to the same cluster is whether the distance between them is below some predefined threshhold value. An algorithm for identifying clusters in a for a set of points is below 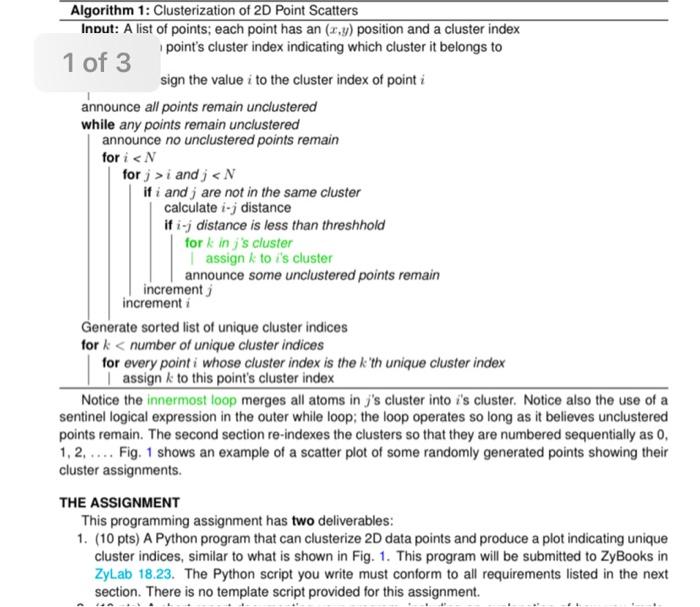
plot module
Algorithm 1: Clusterization of 2D Point Scatters Input: A list of points: each point has an (x,y) position and a cluster index point's cluster index indicating which cluster it belongs to 1 of 3 sign the value i to the cluster index of point i announce all points remain unclustered while any points remain unclustered announce no unclustered points remain for i
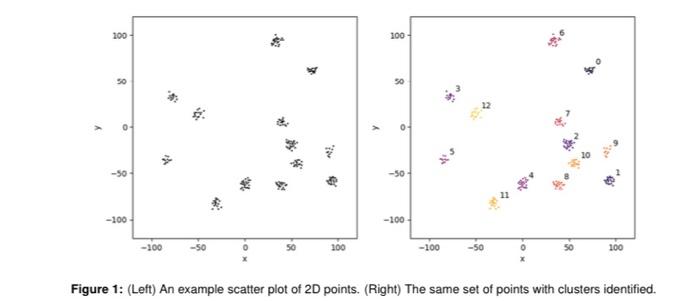
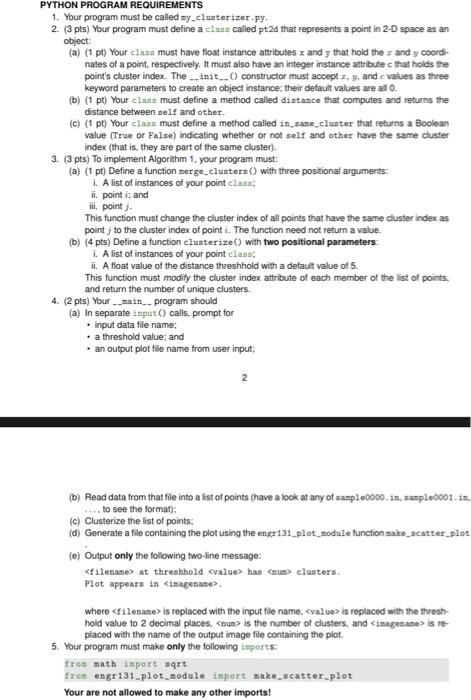
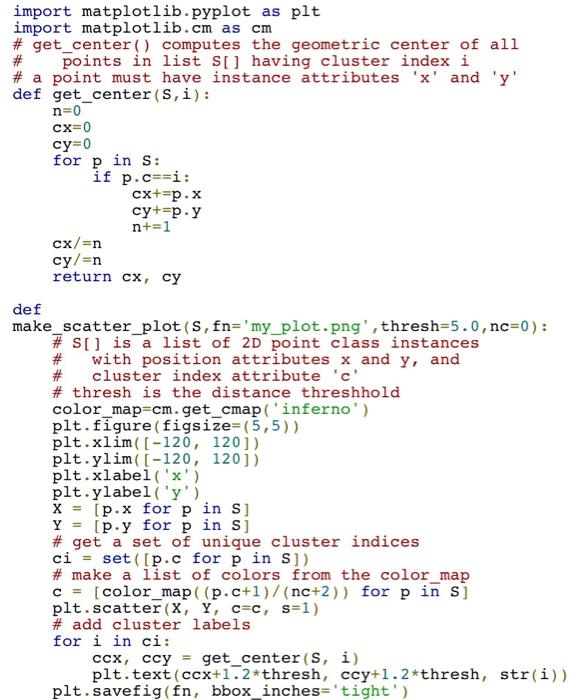
i and j -50 -50 -100 -100 -100 FOM 56 200 -100 so 100 Figure 1: (Left) An example scatter plot of 20 points. (Right) The same set of points with clusters identified. PYTHON PROGRAM REQUIREMENTS 1. Your program must be called my_clusterizer.py. 2. (3 pts) Your program must define a class called pt2d that represents a point in 2-D space as an object: (a) (1 pt) Your class must have float instance attributes and y that hold the - and y coord- nates of a point respectively. It must also have an integer instance attribute that holds the point's cluster index. The init_. constructor must accept 2. y. and evalues as three keyword parameters to create an object instance their default values are all 0. (b) (1 pt) Your class must define a method called distance that computes and returns the distance between self and other. (c) (1 pt) Your class must define a method called in sane_cluster that returns a Boolean value (True or False) indicating whether or not self and other have the same duster index (that is, they are part of the same cluster). 3. (3 pts) To implement Algorithm 1. your program must: (a) (pt) Define a function nerge_clusters() with three positional arguments 1. A list of instances of your point class ii. point is and I. point This function must change the cluster index of all points that have the same duster index as point to the cluster index of point. The function need not return a value. (b) (4 pts) Define a function clusterize() with two positional parameters 1. A list of instances of your point class: ii. A float value of the distance threshold with a default value of 5. This function must modify the cluster index attribute of each member of the list of points, and return the number of unique clusters. 4. (2 pts) Your main program should (a) In separate input) calls, prompt for . input data file name: a threshold value and an output plot file name from user input: 2 (b) Read data from that file into a list of points (have a look at any of sample0000.in, sap0001.in, ... to see the format): (C) Clusterize the list of points: d Generate a file containing the plot using the engr131_plot_module functionare scatter piot (e) Output only the following two-line message: where is replaced with the thresh hold value to 2 decimal places, is the number of clusters, and imagename> is re- placed with the name of the output image file containing the plot. 5. Your program must make only the following imports: fron math import art from engr 131.plot_nodule import make_scatter plot Your are not allowed to make any other imports! import matplotlib.pyplot as plt import matplotlib.cm as cm # get_center() computes the geometric center of all # points in list S[] having cluster index i # a point must have instance attributes 'x' and 'y' def get_center (S,i): n=0 cx=0 cy=0 for p in S: if p.c=ri: cx+=p.x cy+=p.y n+=1 cx/=n cy/=n return cx, cy def make_scatter_plot(S, fn='my_plot.png', thresh=5.0, nc=0): # su is a list of 2D point class instances # with position attributes x and y, and # cluster index attribute 'c' # thresh is the distance threshhold color_map=cm.get_cmap('inferno') plt. figure (figsize=(5,5)) plt.xlim( [-120, 1201) plt.ylim([-120, 120]) plt.xlabel('x') plt.ylabel('y') X = [p.x for p in s] Y [p.y for p in si # get a set of unique cluster indices ci set([p.c for p in s]) # make a list of colors from the color_map c = [color_map ((p.c+1)/(nc+2)) for p in si plt. scatter (X, Y, cec, s=1) # add cluster labels for i in ci: ccx, ccy = get_center(s, i) plt.text(ccx+1.2*thresh, ccy+1.2*thresh, str(i)) plt. savefig(fn, bbox_inches='tight') Algorithm 1: Clusterization of 2D Point Scatters Input: A list of points: each point has an (x,y) position and a cluster index point's cluster index indicating which cluster it belongs to 1 of 3 sign the value i to the cluster index of point i announce all points remain unclustered while any points remain unclustered announce no unclustered points remain for i i and j -50 -50 -100 -100 -100 FOM 56 200 -100 so 100 Figure 1: (Left) An example scatter plot of 20 points. (Right) The same set of points with clusters identified. PYTHON PROGRAM REQUIREMENTS 1. Your program must be called my_clusterizer.py. 2. (3 pts) Your program must define a class called pt2d that represents a point in 2-D space as an object: (a) (1 pt) Your class must have float instance attributes and y that hold the - and y coord- nates of a point respectively. It must also have an integer instance attribute that holds the point's cluster index. The init_. constructor must accept 2. y. and evalues as three keyword parameters to create an object instance their default values are all 0. (b) (1 pt) Your class must define a method called distance that computes and returns the distance between self and other. (c) (1 pt) Your class must define a method called in sane_cluster that returns a Boolean value (True or False) indicating whether or not self and other have the same duster index (that is, they are part of the same cluster). 3. (3 pts) To implement Algorithm 1. your program must: (a) (pt) Define a function nerge_clusters() with three positional arguments 1. A list of instances of your point class ii. point is and I. point This function must change the cluster index of all points that have the same duster index as point to the cluster index of point. The function need not return a value. (b) (4 pts) Define a function clusterize() with two positional parameters 1. A list of instances of your point class: ii. A float value of the distance threshold with a default value of 5. This function must modify the cluster index attribute of each member of the list of points, and return the number of unique clusters. 4. (2 pts) Your main program should (a) In separate input) calls, prompt for . input data file name: a threshold value and an output plot file name from user input: 2 (b) Read data from that file into a list of points (have a look at any of sample0000.in, sap0001.in, ... to see the format): (C) Clusterize the list of points: d Generate a file containing the plot using the engr131_plot_module functionare scatter piot (e) Output only the following two-line message: where is replaced with the thresh hold value to 2 decimal places, is the number of clusters, and imagename> is re- placed with the name of the output image file containing the plot. 5. Your program must make only the following imports: fron math import art from engr 131.plot_nodule import make_scatter plot Your are not allowed to make any other imports! import matplotlib.pyplot as plt import matplotlib.cm as cm # get_center() computes the geometric center of all # points in list S[] having cluster index i # a point must have instance attributes 'x' and 'y' def get_center (S,i): n=0 cx=0 cy=0 for p in S: if p.c=ri: cx+=p.x cy+=p.y n+=1 cx/=n cy/=n return cx, cy def make_scatter_plot(S, fn='my_plot.png', thresh=5.0, nc=0): # su is a list of 2D point class instances # with position attributes x and y, and # cluster index attribute 'c' # thresh is the distance threshhold color_map=cm.get_cmap('inferno') plt. figure (figsize=(5,5)) plt.xlim( [-120, 1201) plt.ylim([-120, 120]) plt.xlabel('x') plt.ylabel('y') X = [p.x for p in s] Y [p.y for p in si # get a set of unique cluster indices ci set([p.c for p in s]) # make a list of colors from the color_map c = [color_map ((p.c+1)/(nc+2)) for p in si plt. scatter (X, Y, cec, s=1) # add cluster labels for i in ci: ccx, ccy = get_center(s, i) plt.text(ccx+1.2*thresh, ccy+1.2*thresh, str(i)) plt. savefig(fn, bbox_inches='tight')<><><><>