

Answered step by step
Verified Expert Solution
Question
1 Approved Answer
I need help with this financial analysis worksheet (last 2 pictures)! Please! Thank you in advance! Calculate the following ratios for both Target and Walmart
I need help with this financial analysis worksheet (last 2 pictures)! Please! Thank you in advance!
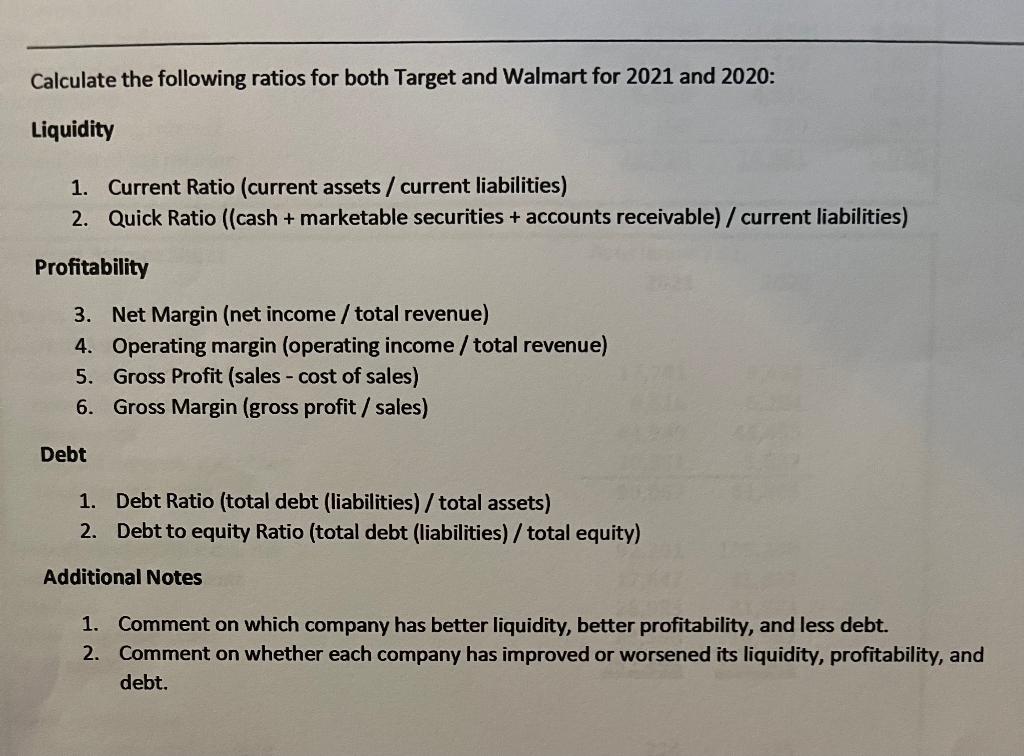
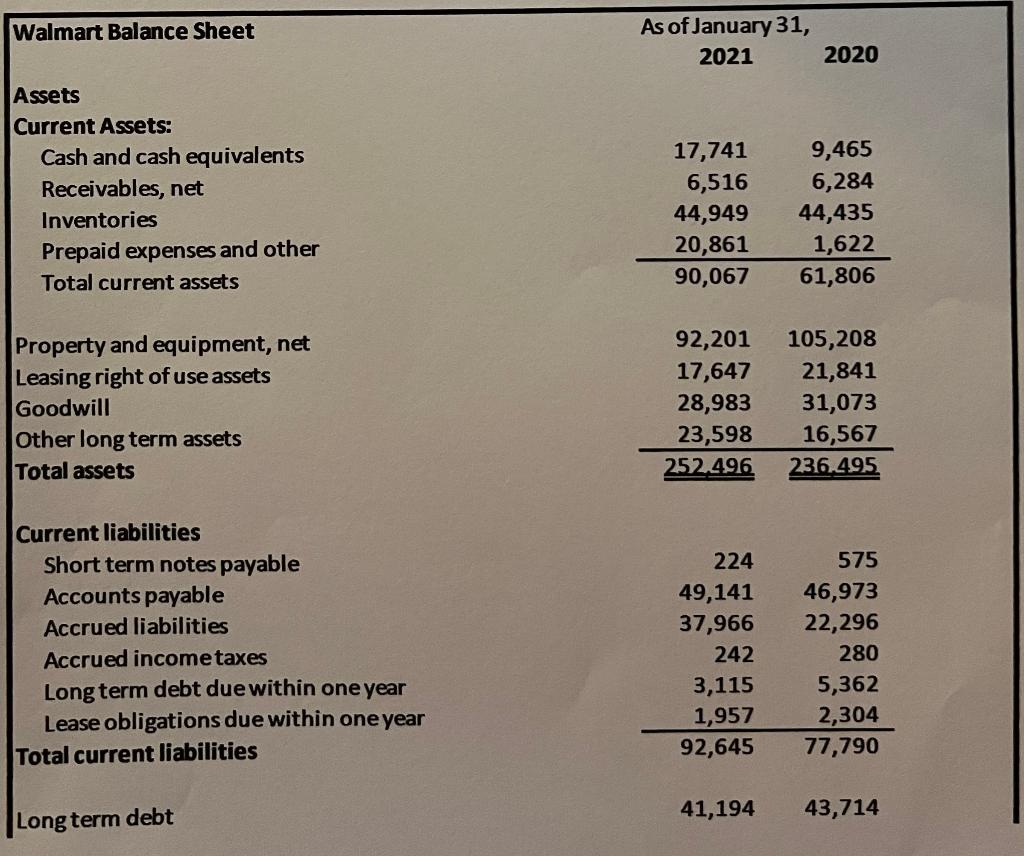
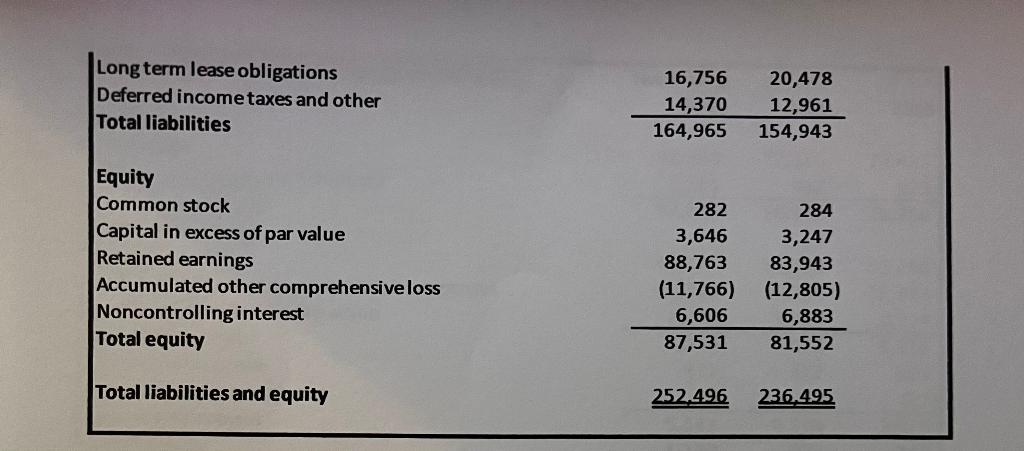
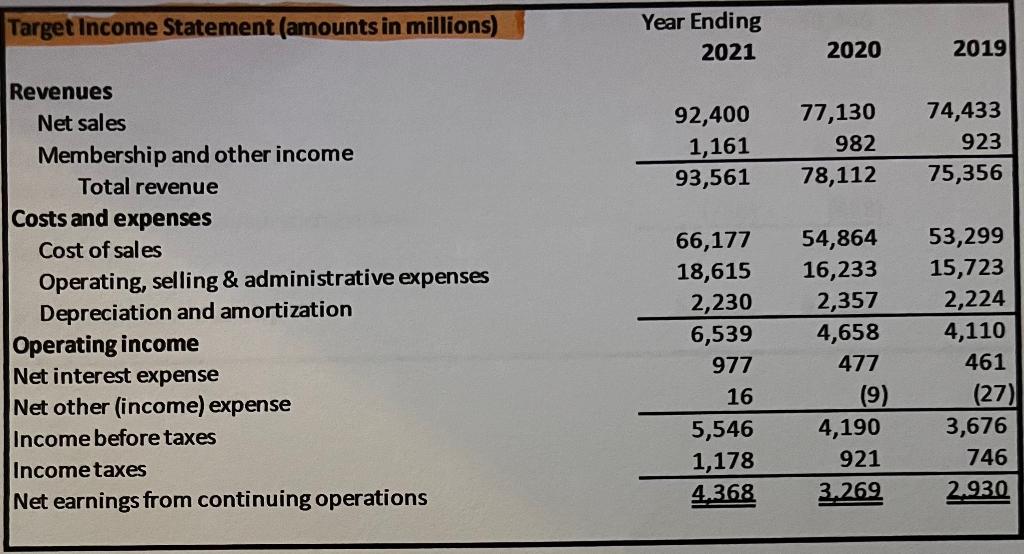
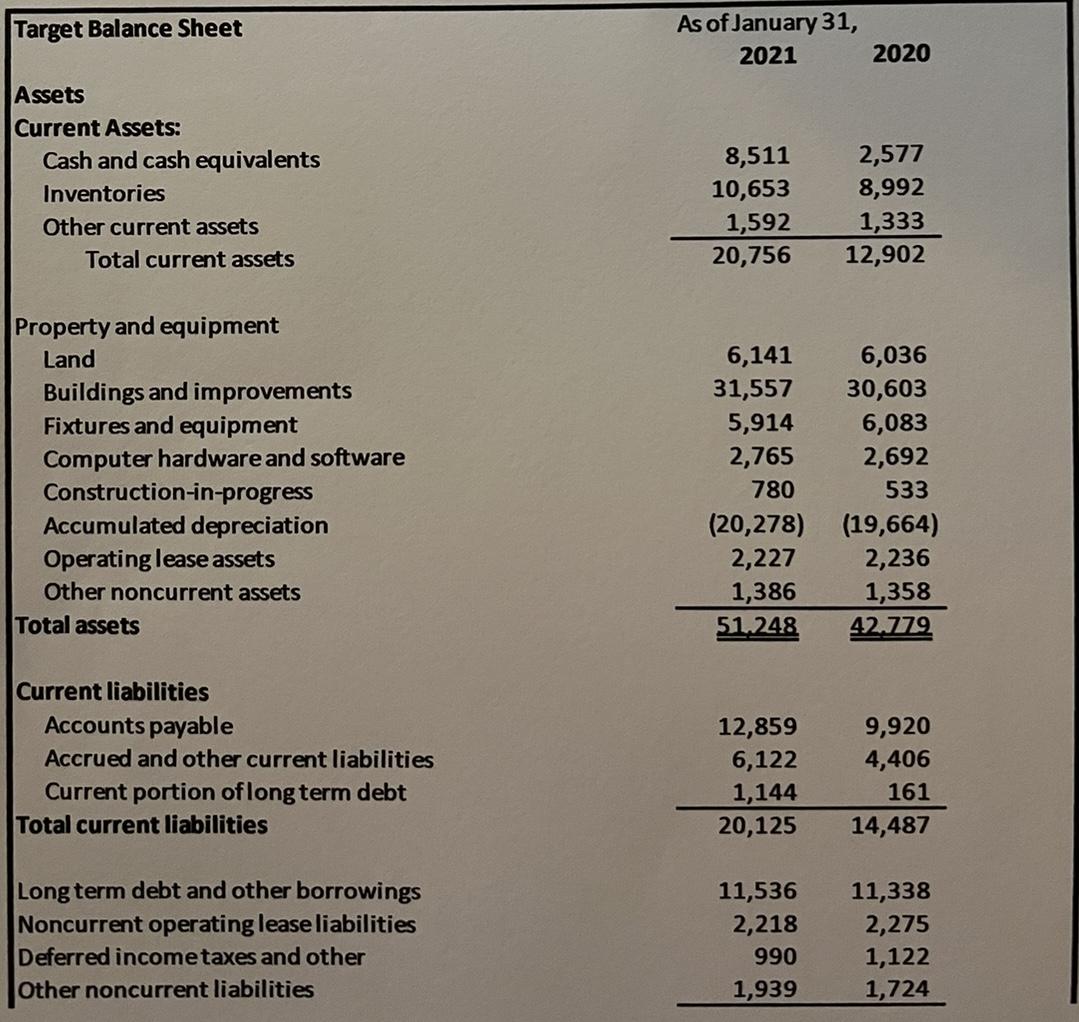
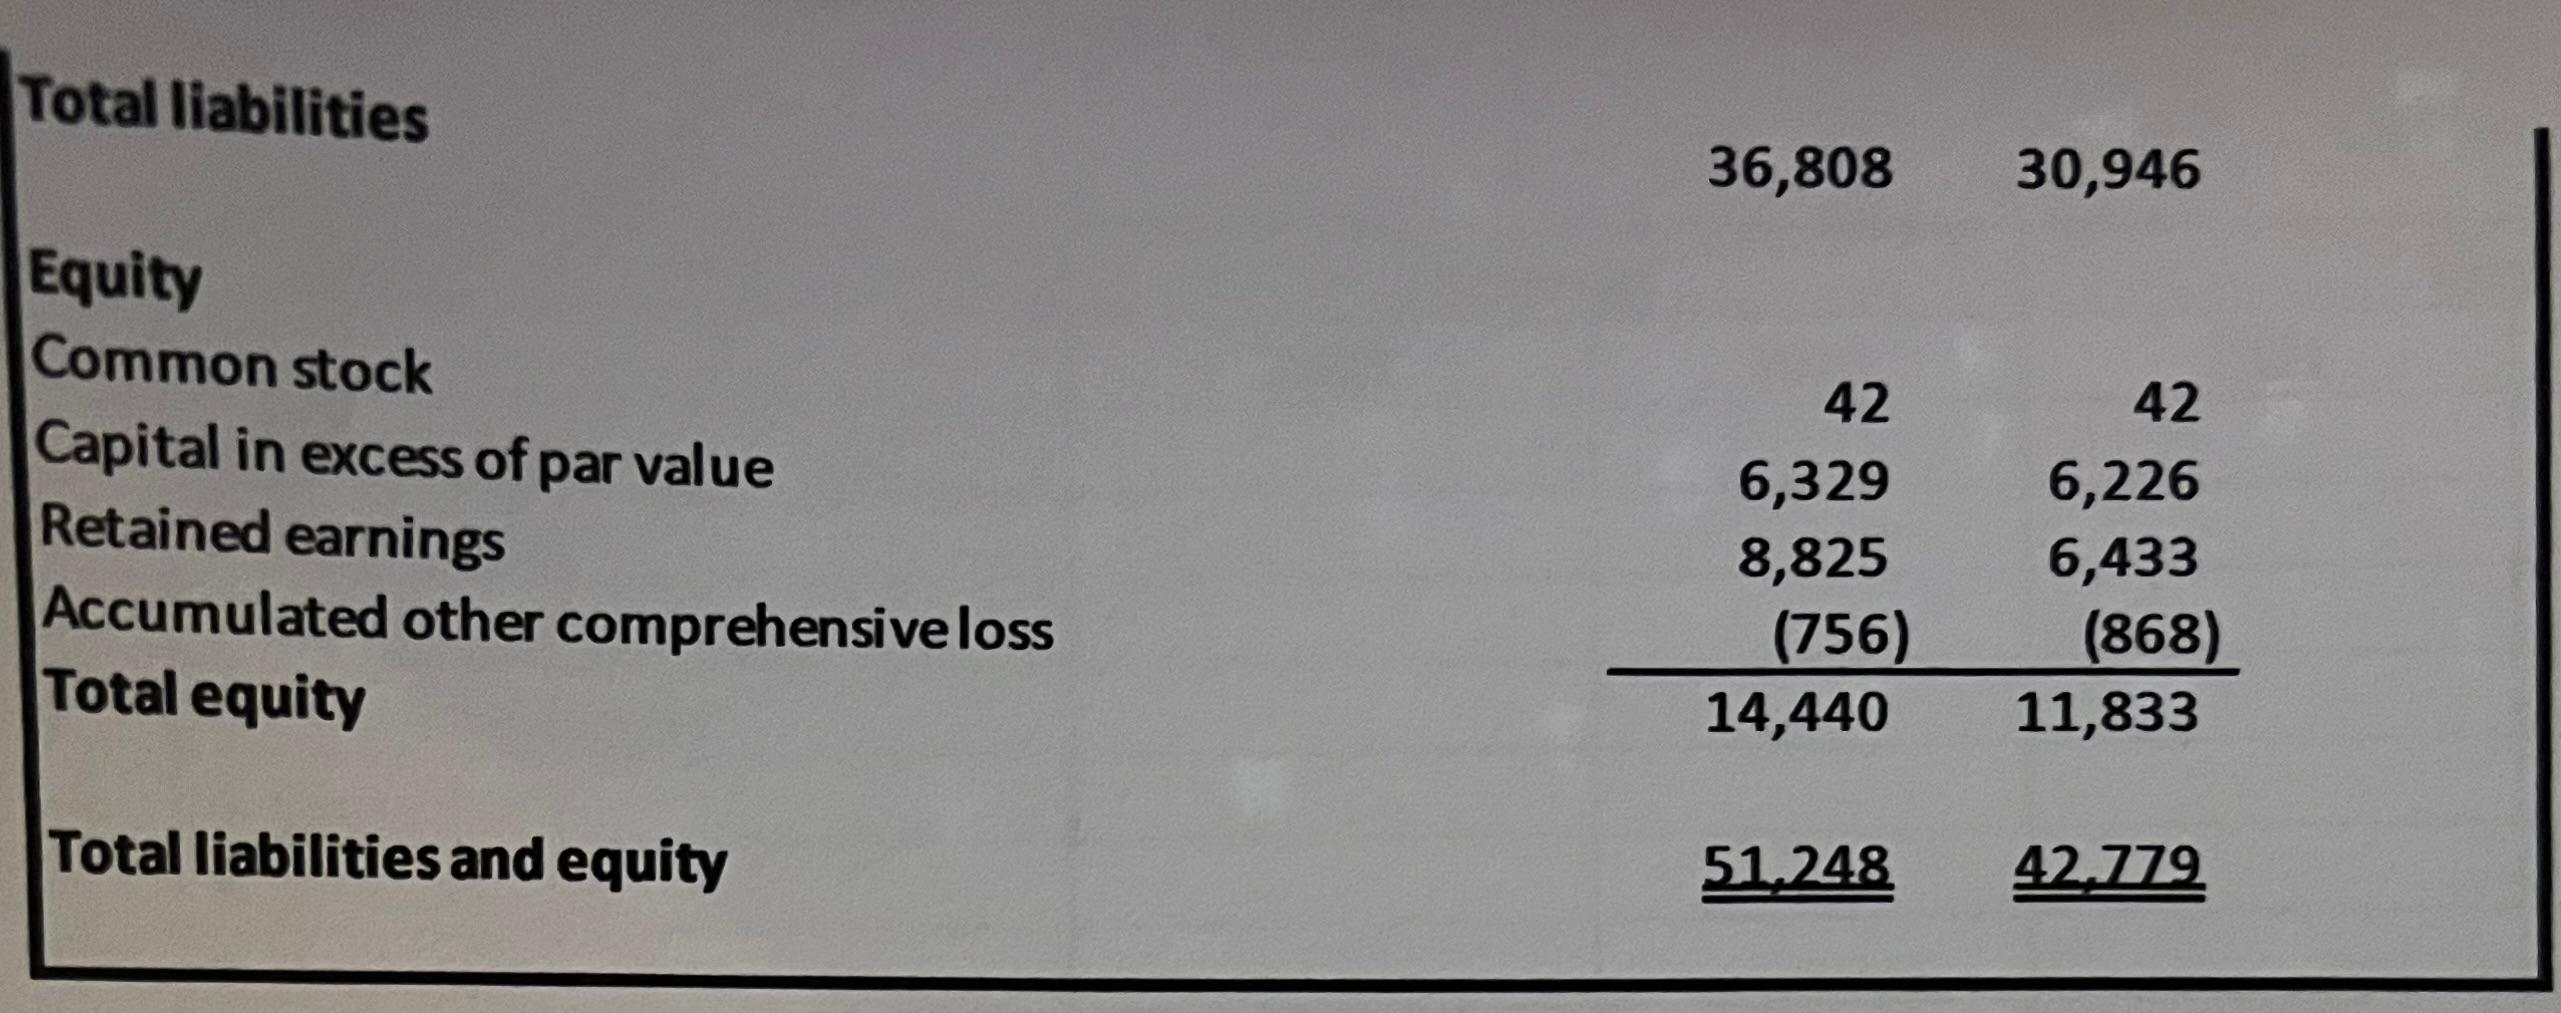
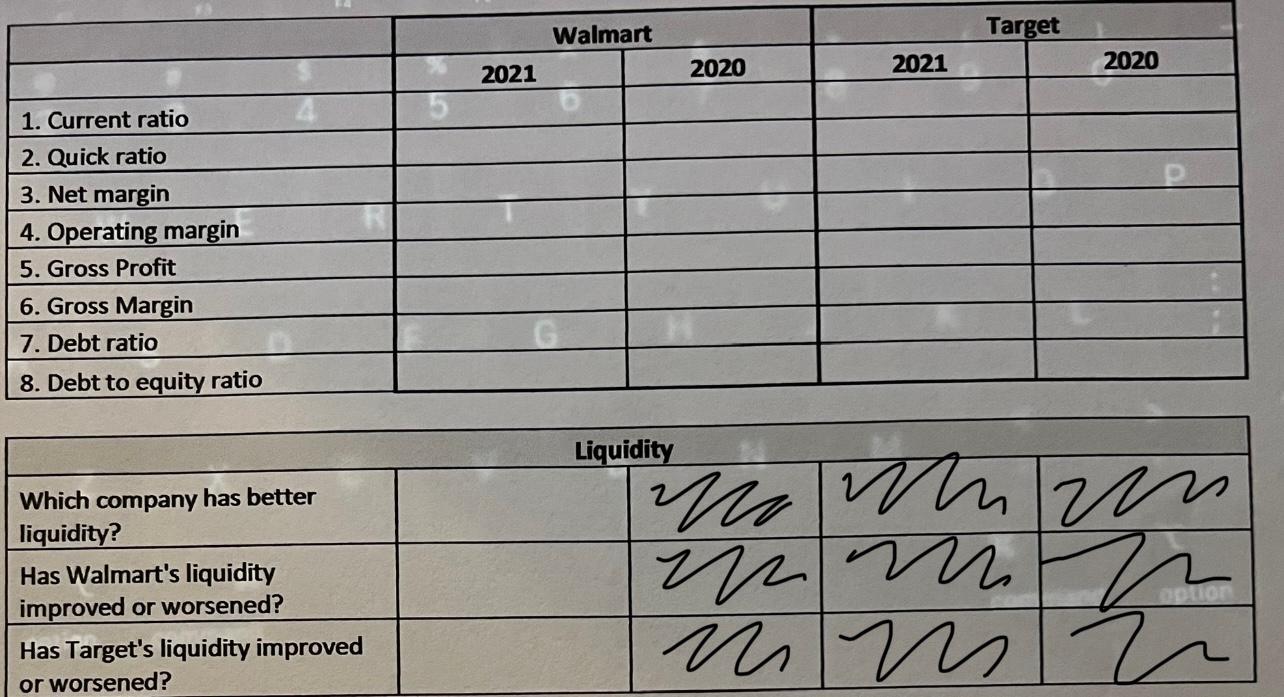
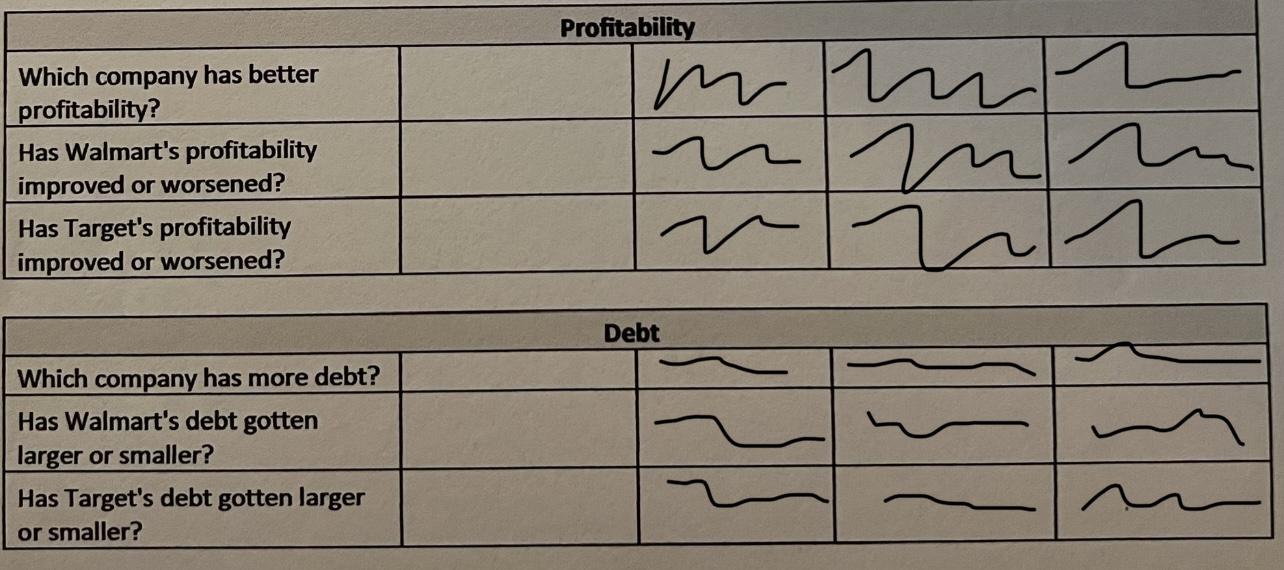
Calculate the following ratios for both Target and Walmart for 2021 and 2020: Liquidity 1. Current Ratio (current assets / current liabilities) 2. Quick Ratio ((cash + marketable securities + accounts receivable) / current liabilities) Profitability 3. Net Margin (net income / total revenue) 4. Operating margin (operating income/total revenue) 5. Gross Profit (sales - cost of sales) 6. Gross Margin (gross profit / sales) Debt 1. Debt Ratio (total debt (liabilities) / total assets) 2. Debt to equity Ratio (total debt (liabilities) / total equity) Additional Notes 1. Comment on which company has better liquidity, better profitability, and less debt. 2. Comment on whether each company has improved or worsened its liquidity, profitability, and debt. Walmart Balance Sheet As of January 31, 2021 2020 Assets Current Assets: Cash and cash equivalents Receivables, net Inventories Prepaid expenses and other Total current assets \begin{tabular}{rr} 17,741 & 9,465 \\ 6,516 & 6,284 \\ 44,949 & 44,435 \\ 20,861 & 1,622 \\ \hline 90,067 & 61,806 \end{tabular} Property and equipment, net Leasing right of use assets Goodwill Other long term assets Total assets \begin{tabular}{rr} 92,201 & 105,208 \\ 17,647 & 21,841 \\ 28,983 & 31,073 \\ 23,598 & 16,567 \\ \hline252,496 & 236,495 \\ \hline \end{tabular} Current liabilities Short term notes payable Accounts payable Accrued liabilities Accrued incometaxes Long term debt due within one year Lease obligations due within one year Total current liabilities \begin{tabular}{rr} 224 & 575 \\ 49,141 & 46,973 \\ 37,966 & 22,296 \\ 242 & 280 \\ 3,115 & 5,362 \\ 1,957 & 2,304 \\ \hline 92,645 & 77,790 \\ 41,194 & 43,714 \end{tabular} Long term lease obligations Deferred income taxes and other Total liabilities \begin{tabular}{rr} 16,756 & 20,478 \\ 14,370 & 12,961 \\ \hline 164,965 & 154,943 \end{tabular} Equity Common stock Capital in excess of par value Retained earnings Accumulated other comprehensive loss Noncontrolling interest Total equity \begin{tabular}{rr} 282 & 284 \\ 3,646 & 3,247 \\ 88,763 & 83,943 \\ (11,766) & (12,805) \\ 6,606 & 6,883 \\ \hline 87,531 & 81,552 \end{tabular} Total liabilities and equity 252,496236,4.95 Target Balance Sheet As of January 31, 20212020 Assets Current Assets: Cash and cash equivalents Inventories Other current assets Total current assets \begin{tabular}{rr} 8,511 & 2,577 \\ 10,653 & 8,992 \\ 1,592 & 1,333 \\ \hline 20,756 & 12,902 \end{tabular} Property and equipment Land Buildings and improvements Fixtures and equipment Computer hardware and software Construction-in-progress Accumulated depreciation Operating lease assets Other noncurrent assets Total assets \begin{tabular}{rr} 1,386 & 1,358 \\ \hline51,248 & 42,779 \end{tabular} Current liabilities Accounts payable Accrued and other current liabilities Current portion of long term debt Total current liabilities \begin{tabular}{rr} 12,859 & 9,920 \\ 6,122 & 4,406 \\ 1,144 & 161 \\ \hline 20,125 & 14,487 \end{tabular} Long term debt and other borrowings Noncurrent operating lease liabilities Deferred incometaxes and other Other noncurrent liabilities \begin{tabular}{rr} 11,536 & 11,338 \\ 2,218 & 2,275 \\ 990 & 1,122 \\ 1,939 & 1,724 \\ \hline \end{tabular} Total liabilities 36,80830,946 Equity Common stock Capital in excess of par value Retained earnings Accumulated other comprehensive loss Total equity \begin{tabular}{rr} 42 & 42 \\ 6,329 & 6,226 \\ 8,825 & 6,433 \\ (756) & (868) \\ \hline 14,440 & 11,833 \end{tabular} Total liabilities and equity 51,24842,779 \begin{tabular}{|l|l|l|l|l|} \hline & \multicolumn{1}{|c|}{ Walmart } & \multicolumn{1}{|c|}{ Target } \\ \hline & 2021 & 2020 & 2021 & \\ \hline & & & & \\ \hline 1. Current ratio & & & & \\ \hline 2. Quick ratio & & & & \\ \hline 3. Net margin & & & & \\ \hline 4. Operating margin & & & & \\ \hline 5. Gross Profit & & & & \\ \hline 6. Gross Margin & & & & \\ \hline 7. Debt ratio & & & & \\ \hline 8. Debt to equity ratio & & & & \\ \hline \end{tabular} \begin{tabular}{|l|l|l|l|} \hline \multicolumn{3}{|c|}{ Profitability } \\ \hline Which company has better profitability? & & \end{tabular} \begin{tabular}{|l|l|l|l|} \hline \multicolumn{3}{|c|}{ Debt } \\ \hline Which company has more debt? & & & \end{tabular}
Step by Step Solution
There are 3 Steps involved in it
Step: 1

Get Instant Access to Expert-Tailored Solutions
See step-by-step solutions with expert insights and AI powered tools for academic success
Step: 2

Step: 3
Ace Your Homework with AI
Get the answers you need in no time with our AI-driven, step-by-step assistance
Get Started
Military Finances Personal Money Management For Service Members Veterans And Their Families
Authors: Cheryl Lawhorne-Scott, Don Philpott
1st Edition
144222214X, 978-1442222144