I need help with this
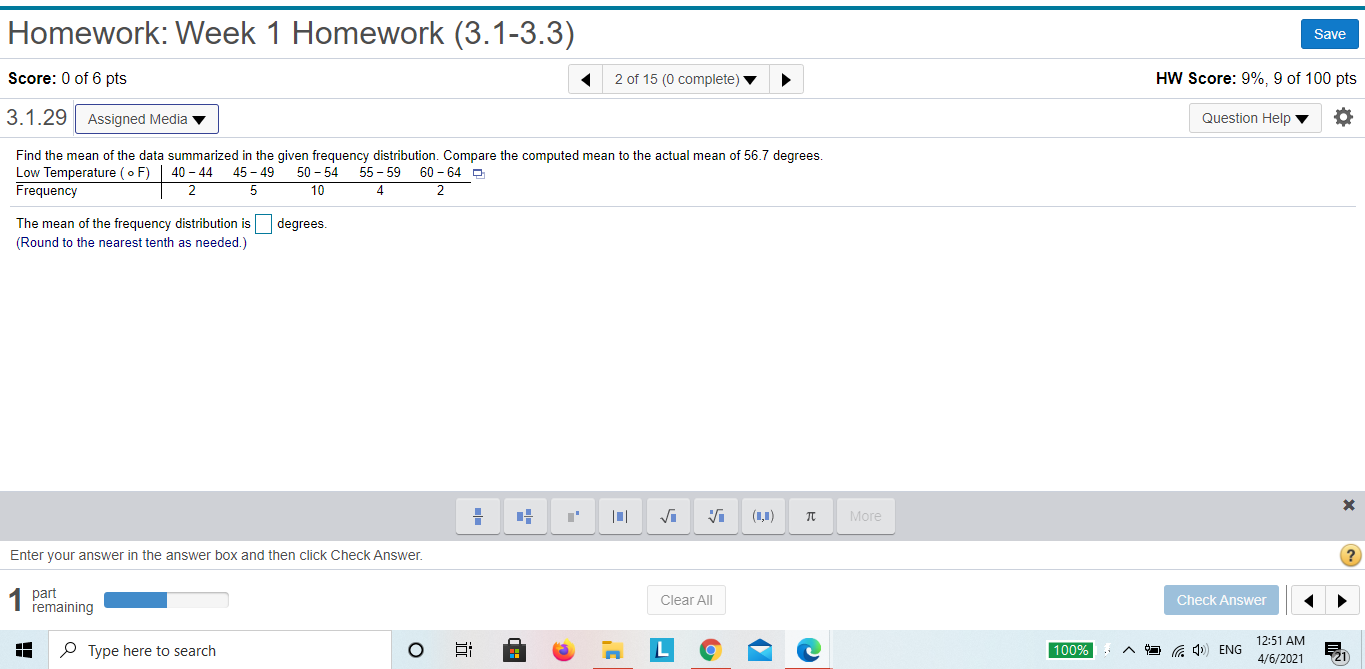
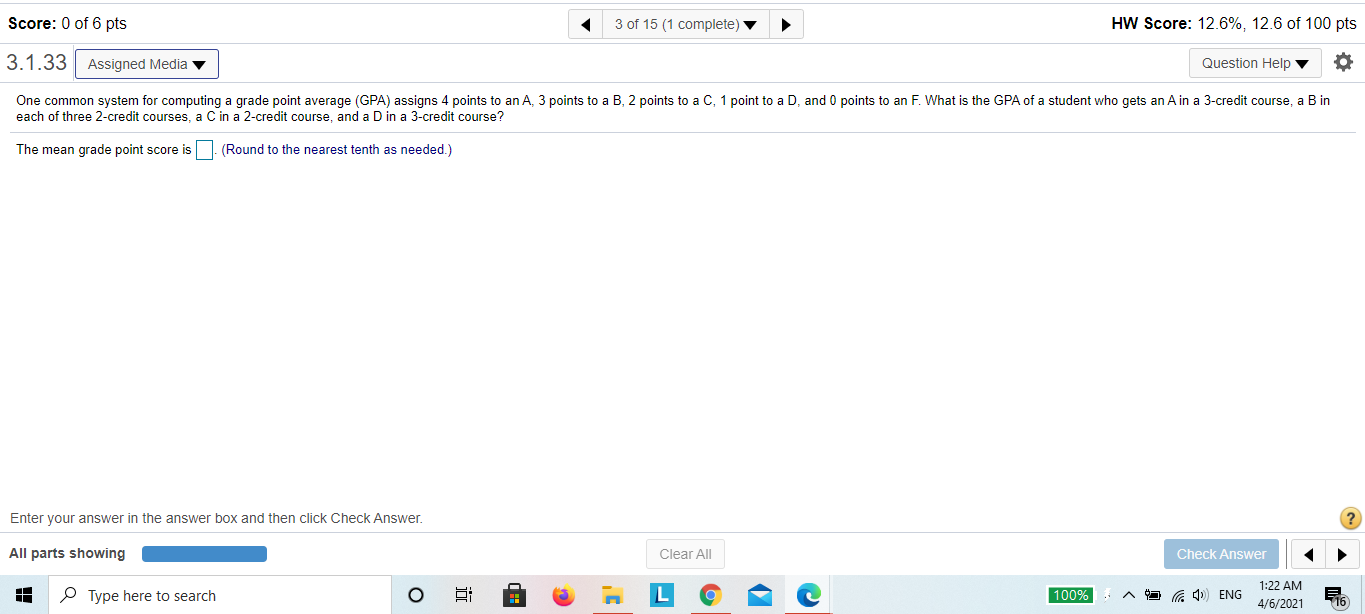
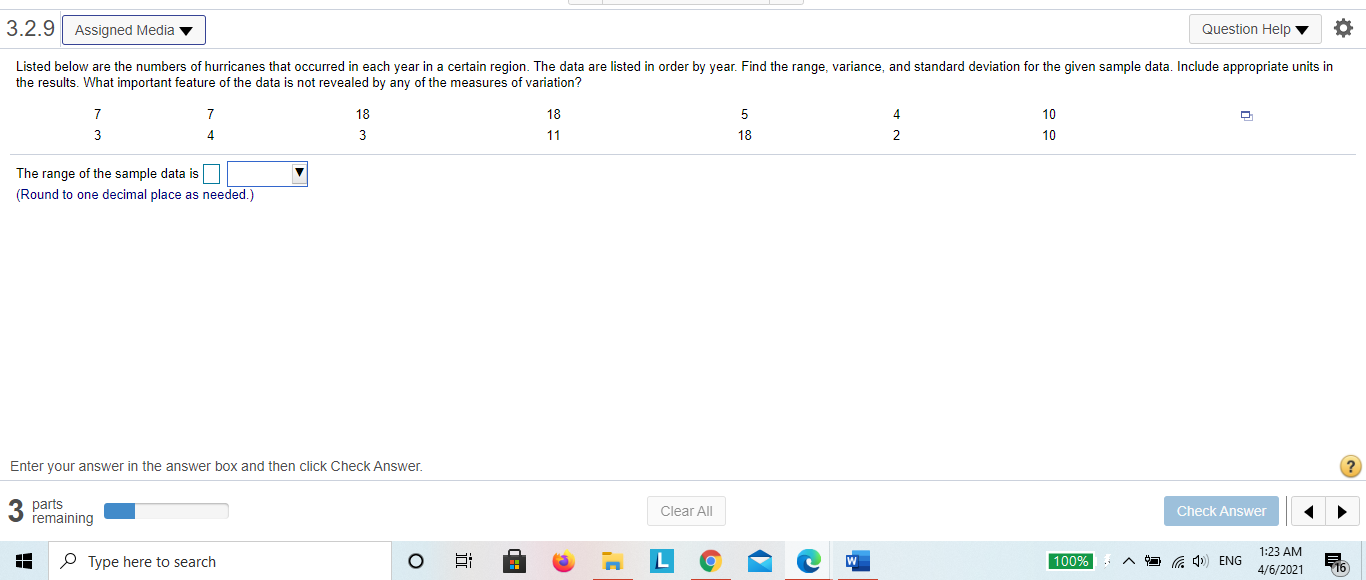
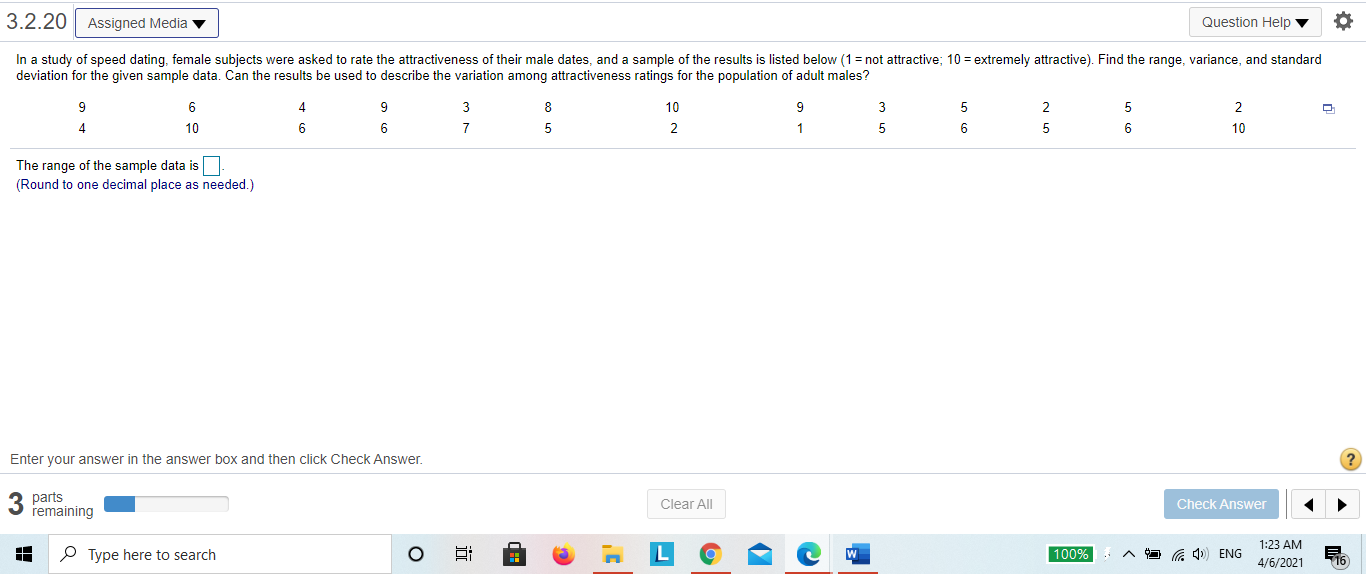
Homework: Week 1 Homework (3. 1-3.3) Save Score: 0 of 6 pts 2 of 15 (0 complete) HW Score: 9%, 9 of 100 pts 3.1.29 Assigned Media Question Help Find the mean of the data summarized in the given frequency distribution. Compare the computed mean to the actual mean of 56.7 degrees. Low Temperature ( . F) | 40 - 44 45-49 50-54 55-59 60-64 Frequency 5 10 4 2 The mean of the frequency distribution is degrees. (Round to the nearest tenth as needed.) Vi Vi More Enter your answer in the answer box and then click Check Answer. ? part remaining Clear All Check Answer Type here to search O L 100% : A ENG 12:51 AM 4/6/2021Score: 0 of 6 pts 3 of 15 (1 complete) HW Score: 12.6%, 12.6 of 100 pts 3.1.33 Assigned Media Question Help One common system for computing a grade point average (GPA) assigns 4 points to an A, 3 points to a B, 2 points to a C, 1 point to a D, and 0 points to an F. What is the GPA of a student who gets an A in a 3-credit course, a B in each of three 2-credit courses, a C in a 2-credit course, and a D in a 3-credit course? The mean grade point score is . (Round to the nearest tenth as needed.) Enter your answer in the answer box and then click Check Answer. ? All parts showing Clear All Check Answer Type here to search O L 1:22 AM F 100% : A ( )ENG 4/6/20213.2.9 Assigned Media Question Help Listed below are the numbers of hurricanes that occurred in each year in a certain region. The data are listed in order by year. Find the range, variance, and standard deviation for the given sample data. Include appropriate units in the results. What important feature of the data is not revealed by any of the measures of variation? 18 18 10 w W 11 18 10 The range of the sample data is (Round to one decimal place as needed.) Enter your answer in the answer box and then click Check Answer. ? 3 parts remaining Clear All Check Answer Type here to search O L W 1:23 AM 100% A 19 ( ) ENG 4/6/2021 E163.2.20 Assigned Media Question Help In a study of speed dating, female subjects were asked to rate the attractiveness of their male dates, and a sample of the results is listed below (1 = not attractive; 10 = extremely attractive). Find the range, variance, and standard deviation for the given sample data. Can the results be used to describe the variation among attractiveness ratings for the population of adult males? 10 w N UN un co 10 N 10 The range of the sample data is. (Round to one decimal place as needed.) Enter your answer in the answer box and then click Check Answer. ? 3 parts remaining Clear All Check Answer 1:23 AM Type here to search O BOM L 9 W 100% A D / () ENG 4/6/2021


