

Answered step by step
Verified Expert Solution
Question
1 Approved Answer
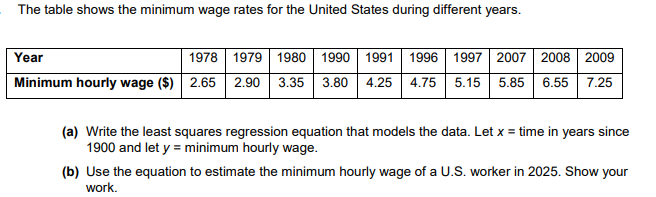
I need help with this math problem in the photo! Please teach me!!!!!!!! The table shows the minimum wage rates for the United States during
I need help with this math problem in the photo! Please teach me!!!!!!!!
Step by Step Solution
There are 3 Steps involved in it
Step: 1

Get Instant Access to Expert-Tailored Solutions
See step-by-step solutions with expert insights and AI powered tools for academic success
Step: 2

Step: 3
Ace Your Homework with AI
Get the answers you need in no time with our AI-driven, step-by-step assistance
Get Started
Finite Geometry And Combinatorics
Authors: F De Clerck ,J Hirschfeld
1st Edition
0521448506, 978-0521448505