Answered step by step
Verified Expert Solution
Link Copied!

Question

1 Approved Answer

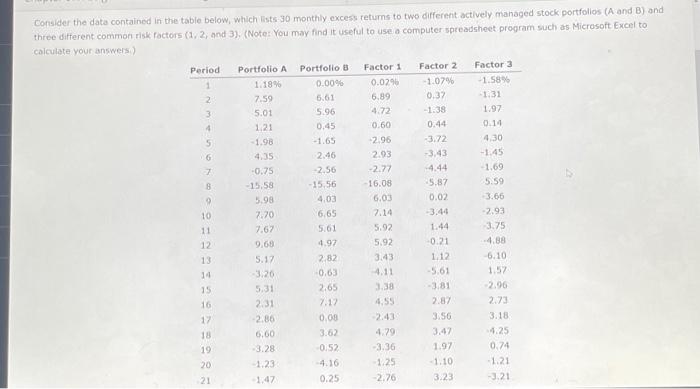
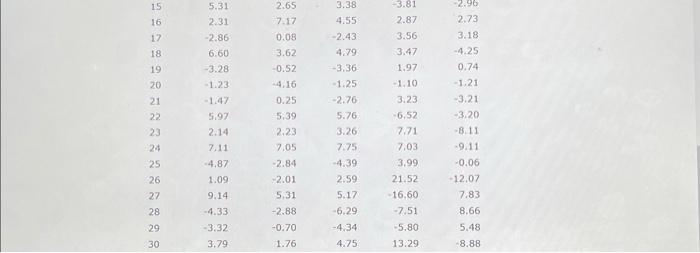
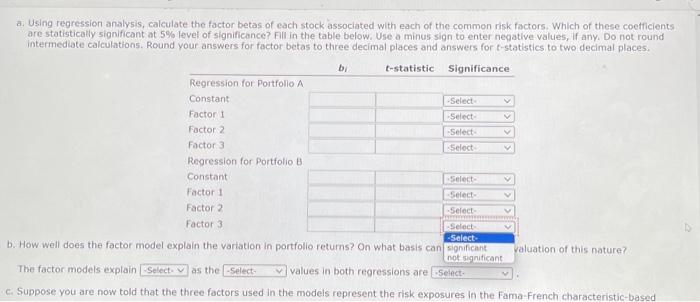
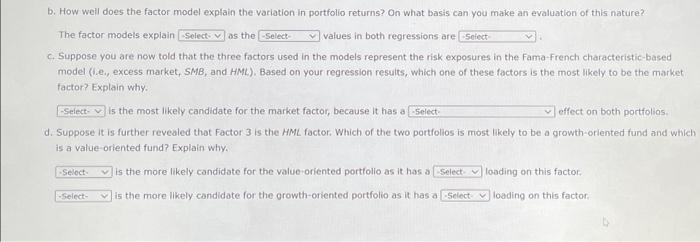
I need help with this please do an Excel show me how you did it with formulas 151617181920212223242526272829305.312.312.866.603.281.231.475.972.147.114.871.099.144.333.323.792.657.170.083.620.524.160.255.392.237.052.842.015.312.880.701.763.384.552.434.793.361.252.765.763.267.754.392.595.176.294.344.753.812.873.563.471.971.103.236.527.717.033.9921.5216.607.515.8013.292.962.733.184.250.741.213.213.208.119.110.0612.077.838.665.488.88 a. Using regression analysis, calculate the factor

I need help with this please do an Excel show me how you did it with formulas
image text in transcribed
151617181920212223242526272829305.312.312.866.603.281.231.475.972.147.114.871.099.144.333.323.792.657.170.083.620.524.160.255.392.237.052.842.015.312.880.701.763.384.552.434.793.361.252.765.763.267.754.392.595.176.294.344.753.812.873.563.471.971.103.236.527.717.033.9921.5216.607.515.8013.292.962.733.184.250.741.213.213.208.119.110.0612.077.838.665.488.88 a. Using regression analysis, calculate the factor betas of each stock associated with each of the common risk factors. Which of these coetficients are statistically significant at 5% level of significance? Fill in the table below. Use a minus sign to enter negative values, if any. Do not round intermediate calculations. Round your answers for factor betas to three decimal places and answers for t-statistics to two decimal places. b. How well does the factor model explain the variation in portfolio returns? On what basis car The factor models explain as the values in both regressions are c. Suppose you are now told that the three factors used in the models represent the risk exposures in the fama-French characteristic-based Consider the data contained in the table below, which lists 30 monthly excess returns to two different actively managed stock portfolios (A and B) and three different common risk foctors (1,2; and 3). (Note: You may find it useful to use a computer spreadsheet program such as Microsoft Excel to b. How well does the factor model explain the variation in portfolio returns? On what basis can you make an evaluation of this nature? The factor models explain as the values in both regressions are c. Suppose you are now told that the three factors used in the models represent the risk exposures in the Fama-French characteristic-based model (i.e., excess market, SMB, and HML). Based on your regression resuits, which one of these factors is the most likely to be the market factor? Explain why. is the most likely candidate for the market factor, because it has a effect on both portfolios. d. Suppose it is further revealed that Factor 3 is the HML factor. Which of the two portfolios is most likely to be a growth-oriented fund and which is a value-oriented fund? Explain why. is the more likely candidate for the value oriented portfolio as it has a loading on this factor: is the more likely candidate for the growth-oriented portfolio as it has a loading on this factor

Step by Step Solution

There are 3 Steps involved in it

Step: 1

blur-text-image

Get Instant Access to Expert-Tailored Solutions

See step-by-step solutions with expert insights and AI powered tools for academic success

Step: 2

blur-text-image

Step: 3

blur-text-image

Ace Your Homework with AI

Get the answers you need in no time with our AI-driven, step-by-step assistance

Get Started

Recommended Textbook for

The Oxford Handbook Of State Capitalism And The Firm

Authors: Mike Wright, Geoffrey T. Wood, Alvaro Cuervo-Cazurra, Pei Sun, Ilya Okhmatovskiy, Anna Grosman

1st Edition

ISBN: 0198837364, 978-0198837367

More Books

Students also viewed these Finance questions