Answered step by step
Verified Expert Solution
Link Copied!

Question

1 Approved Answer

I need help with this please! Thank you for your time B. Which class would you say had the better overall performance? Justify your answer.

I need help with this please! Thank you for your time
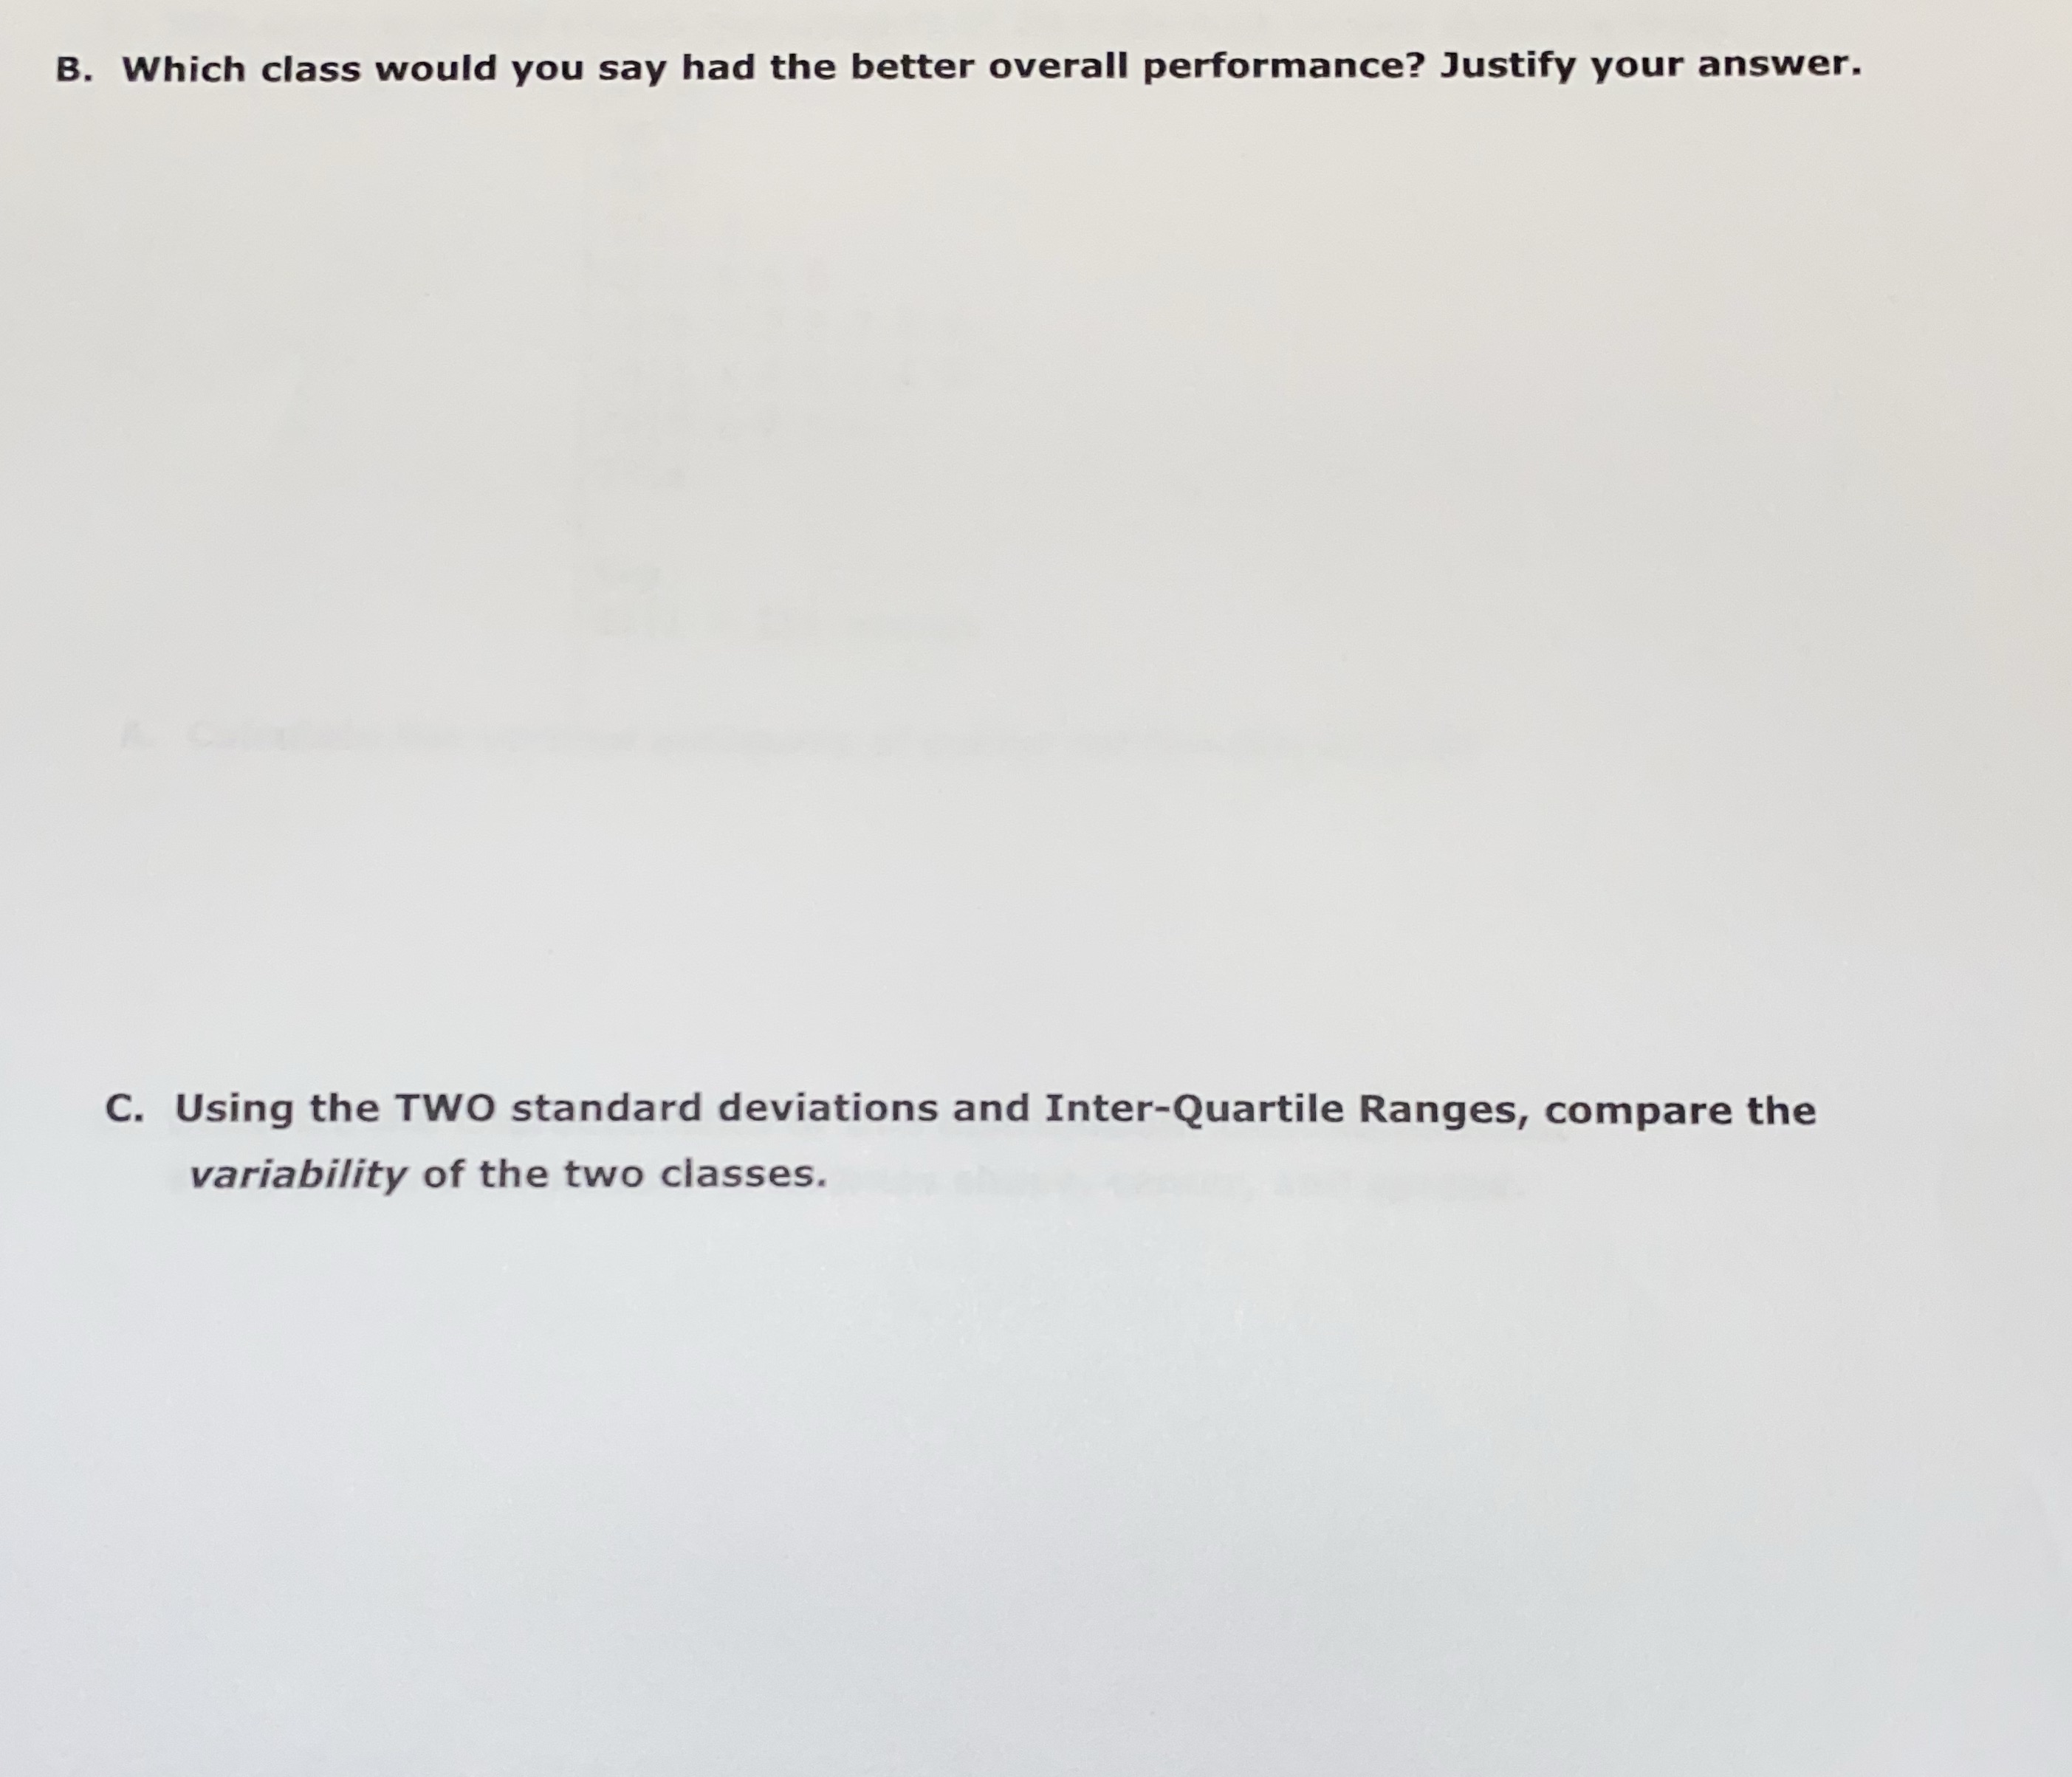
image text in transcribedimage text in transcribed
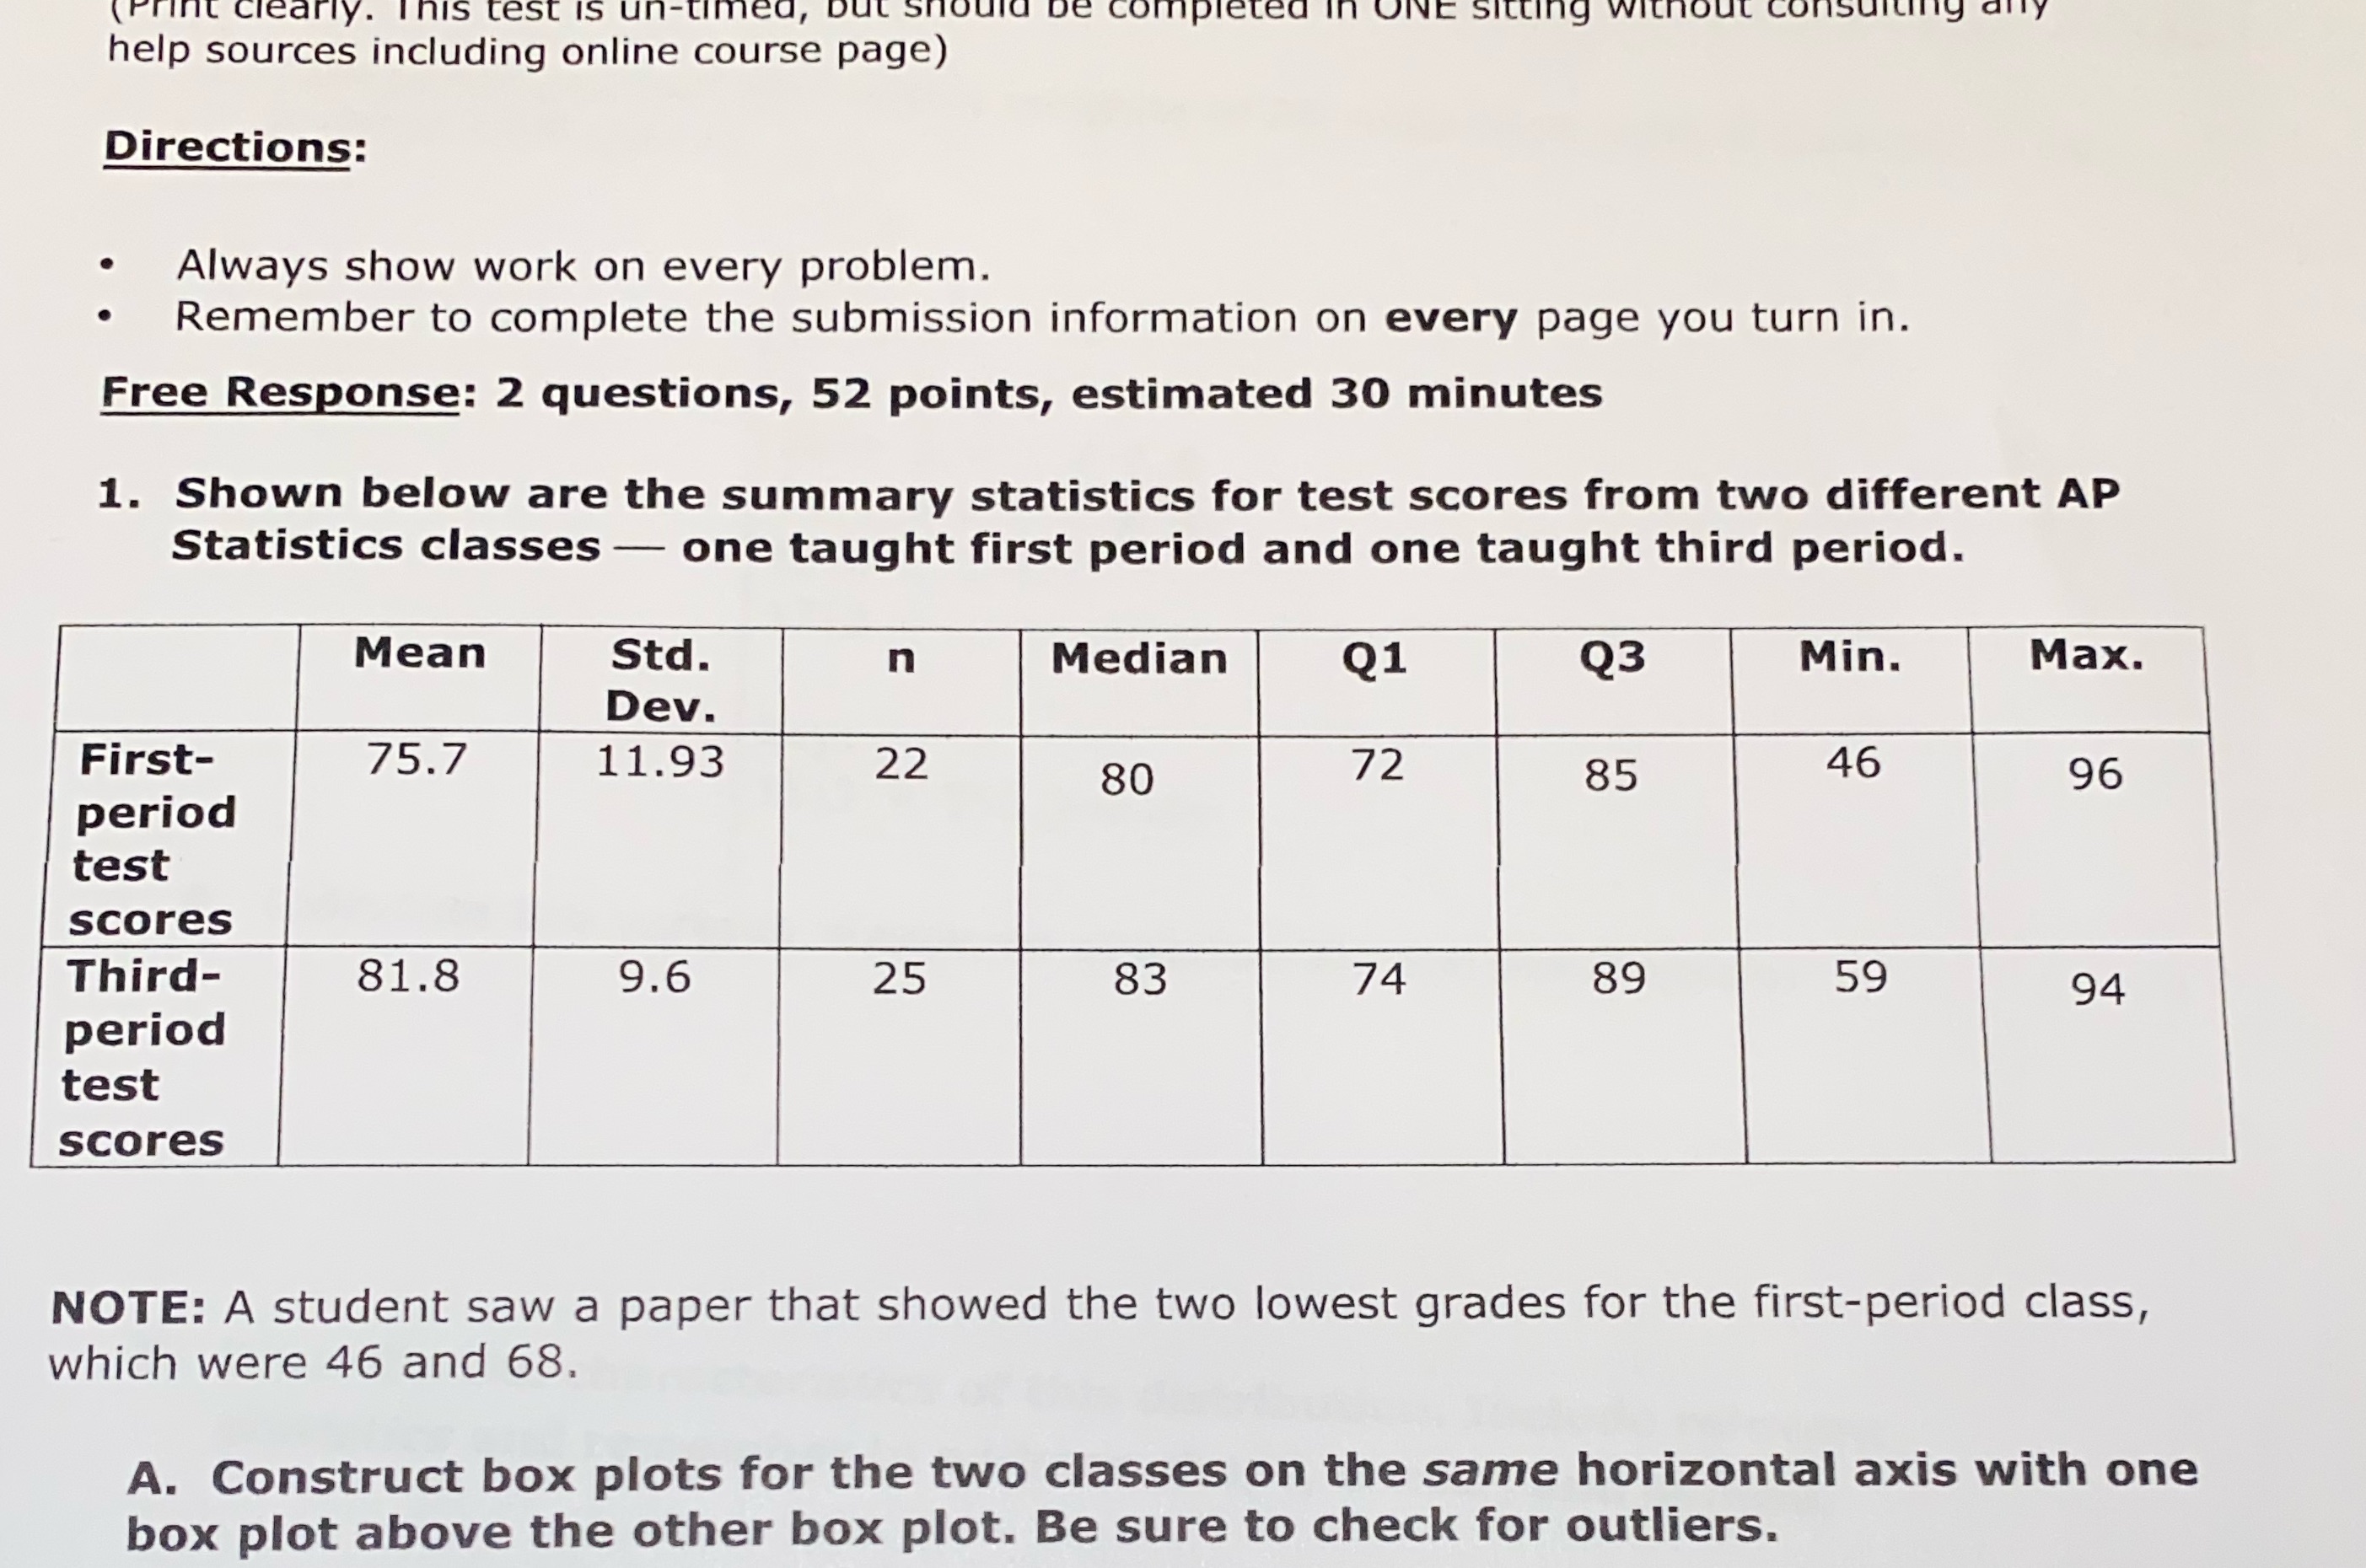
B. Which class would you say had the better overall performance? Justify your answer. C. Using the TWO standard deviations and Inter-Quartile Ranges, compare the variability of the two classes.( Print clearly. This test is un-timed, help sources including online course page) Directions: Always show work on every problem. . Remember to complete the submission information on every page you turn in. Free Response: 2 questions, 52 points, estimated 30 minutes 1. Shown below are the summary statistics for test scores from two different AP Statistics classes - one taught first period and one taught third period. Mean Std. n Median Q1 Q3 Min. Max. Dev. First- 75.7 11.93 22 80 72 85 46 96 period test scores Third- 81.8 9.6 25 83 74 89 59 94 period test scores NOTE: A student saw a paper that showed the two lowest grades for the first-period class, which were 46 and 68. A. Construct box plots for the two classes on the same horizontal axis with one box plot above the other box plot. Be sure to check for outliers

Step by Step Solution

There are 3 Steps involved in it

Step: 1

blur-text-image

Get Instant Access to Expert-Tailored Solutions

See step-by-step solutions with expert insights and AI powered tools for academic success

Step: 2

blur-text-image

Step: 3

blur-text-image

Ace Your Homework with AI

Get the answers you need in no time with our AI-driven, step-by-step assistance

Get Started

Recommended Textbook for

Precalculus, Enhanced

Authors: Cynthia Y Young

3rd Edition

1119339510, 9781119339519

More Books

Students also viewed these Mathematics questions

Question

What was the purpose of this exercise?

Answered: 1 week ago