I need help with this problem:
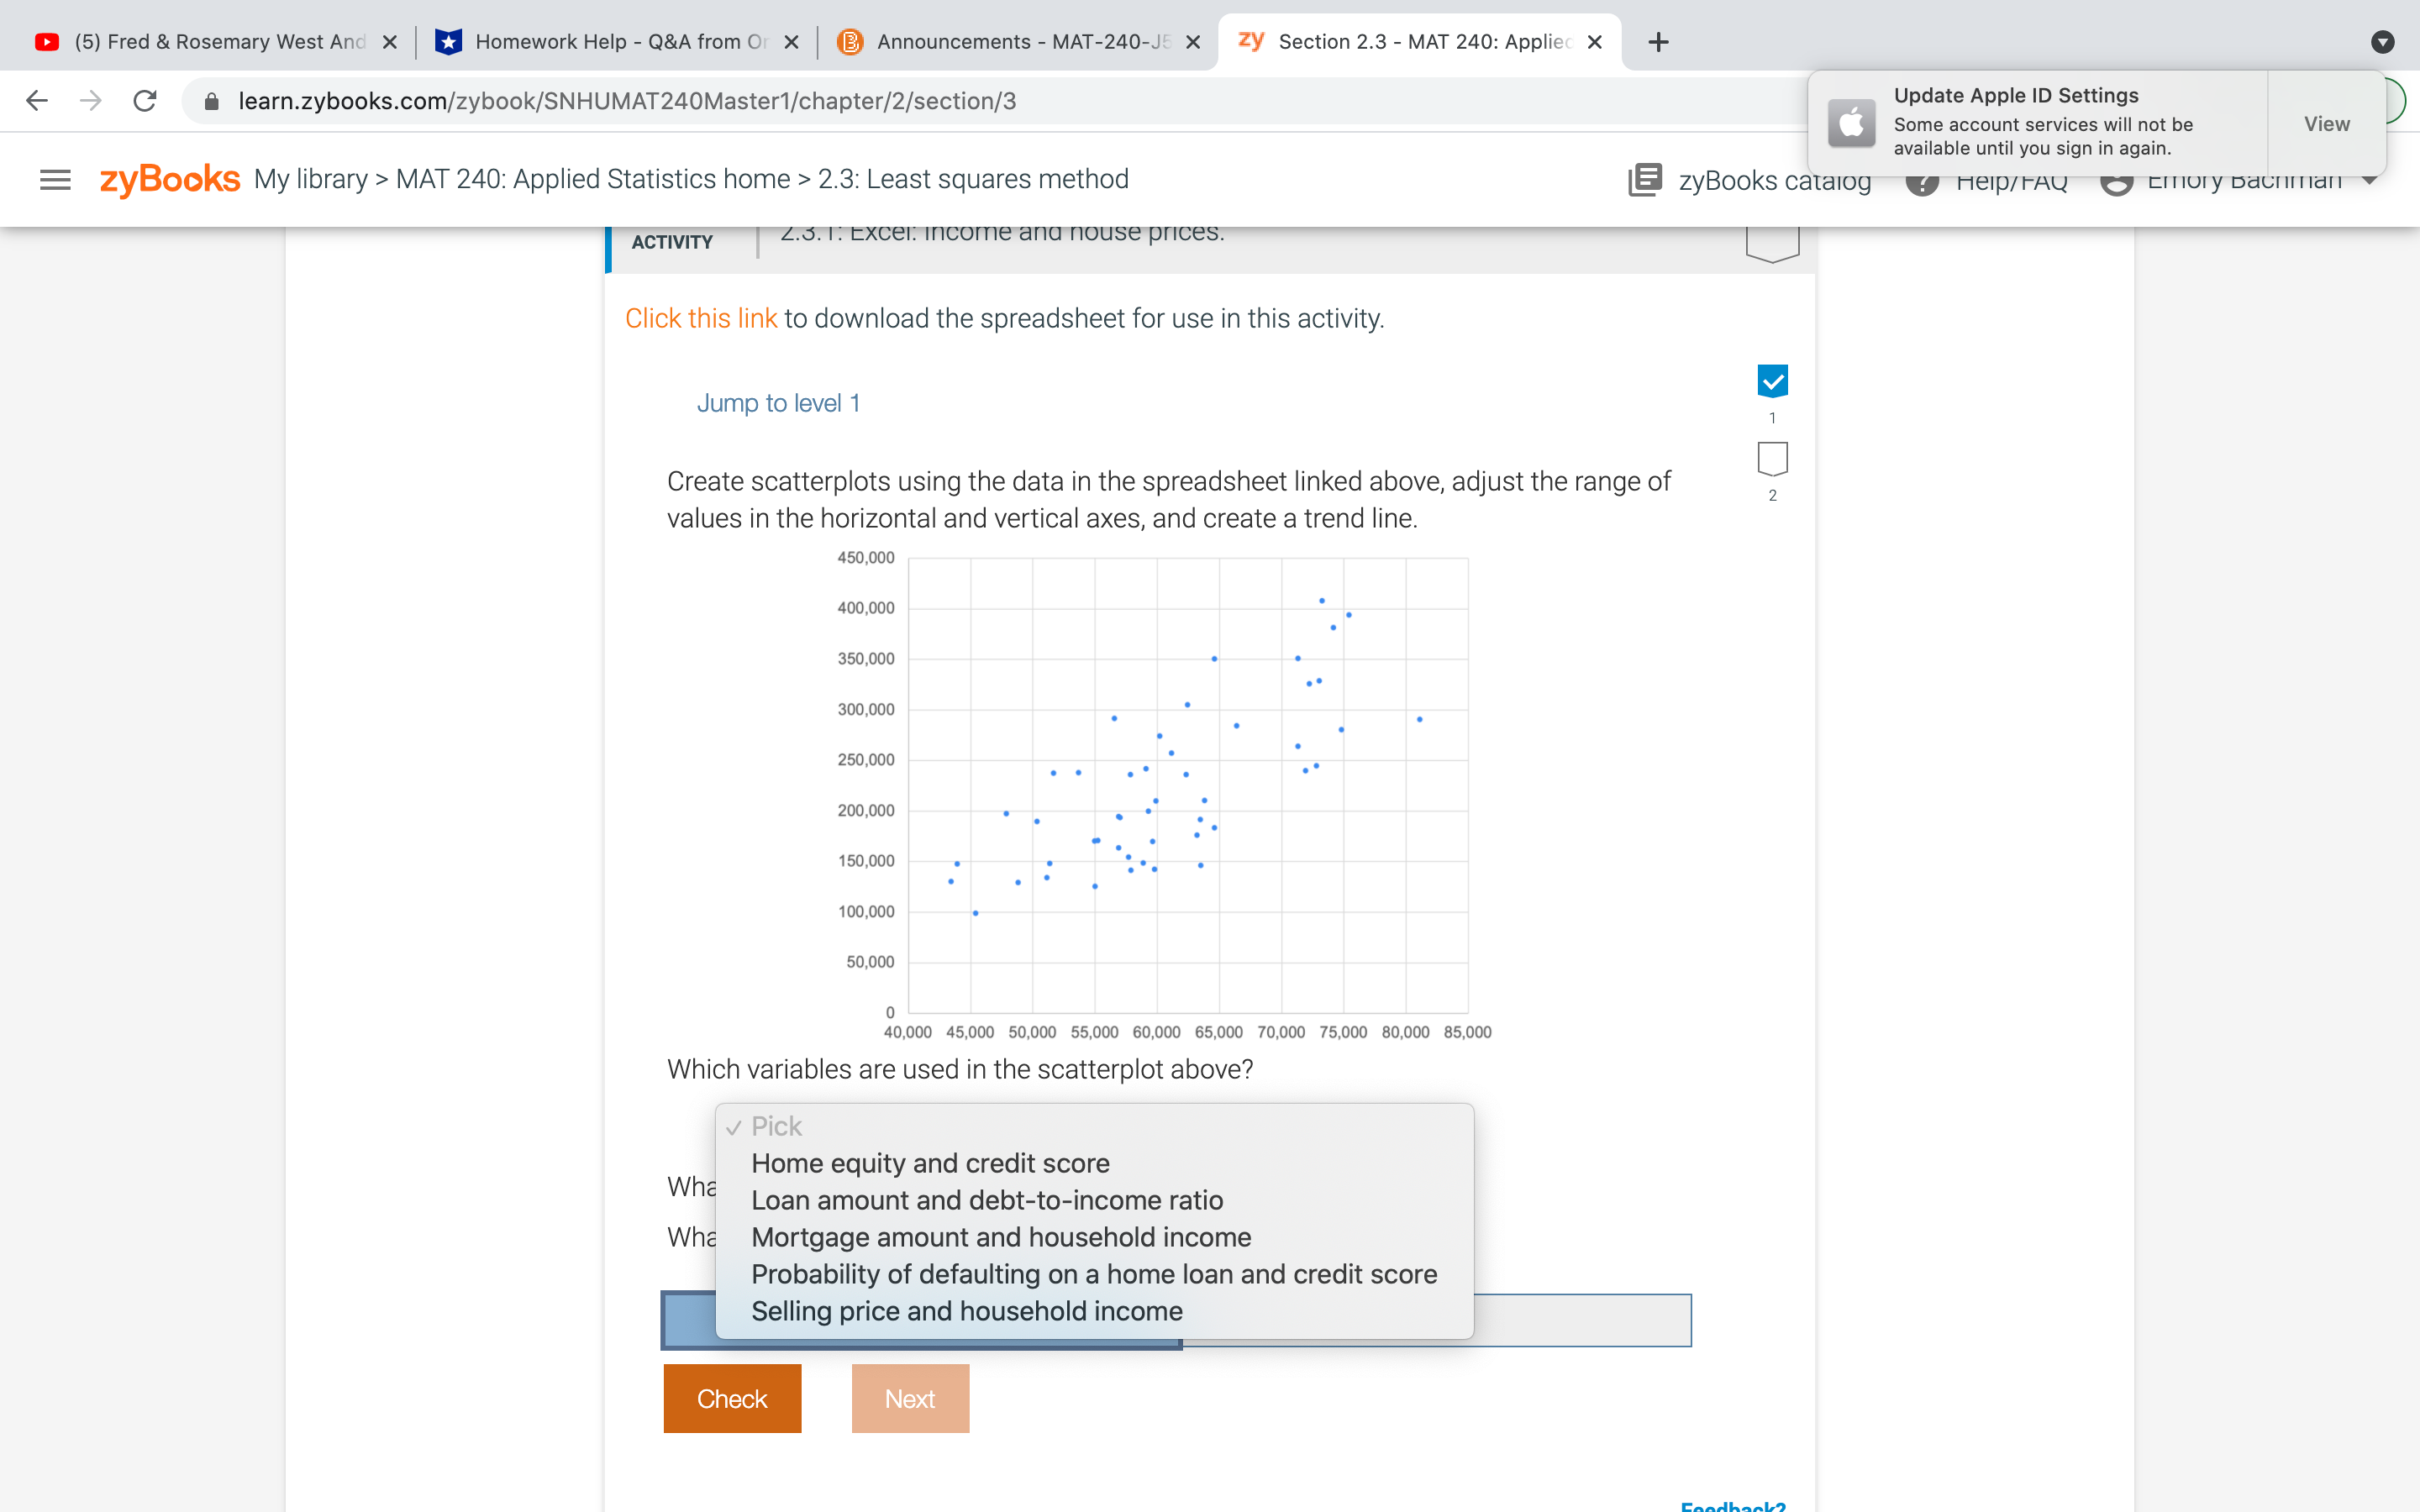
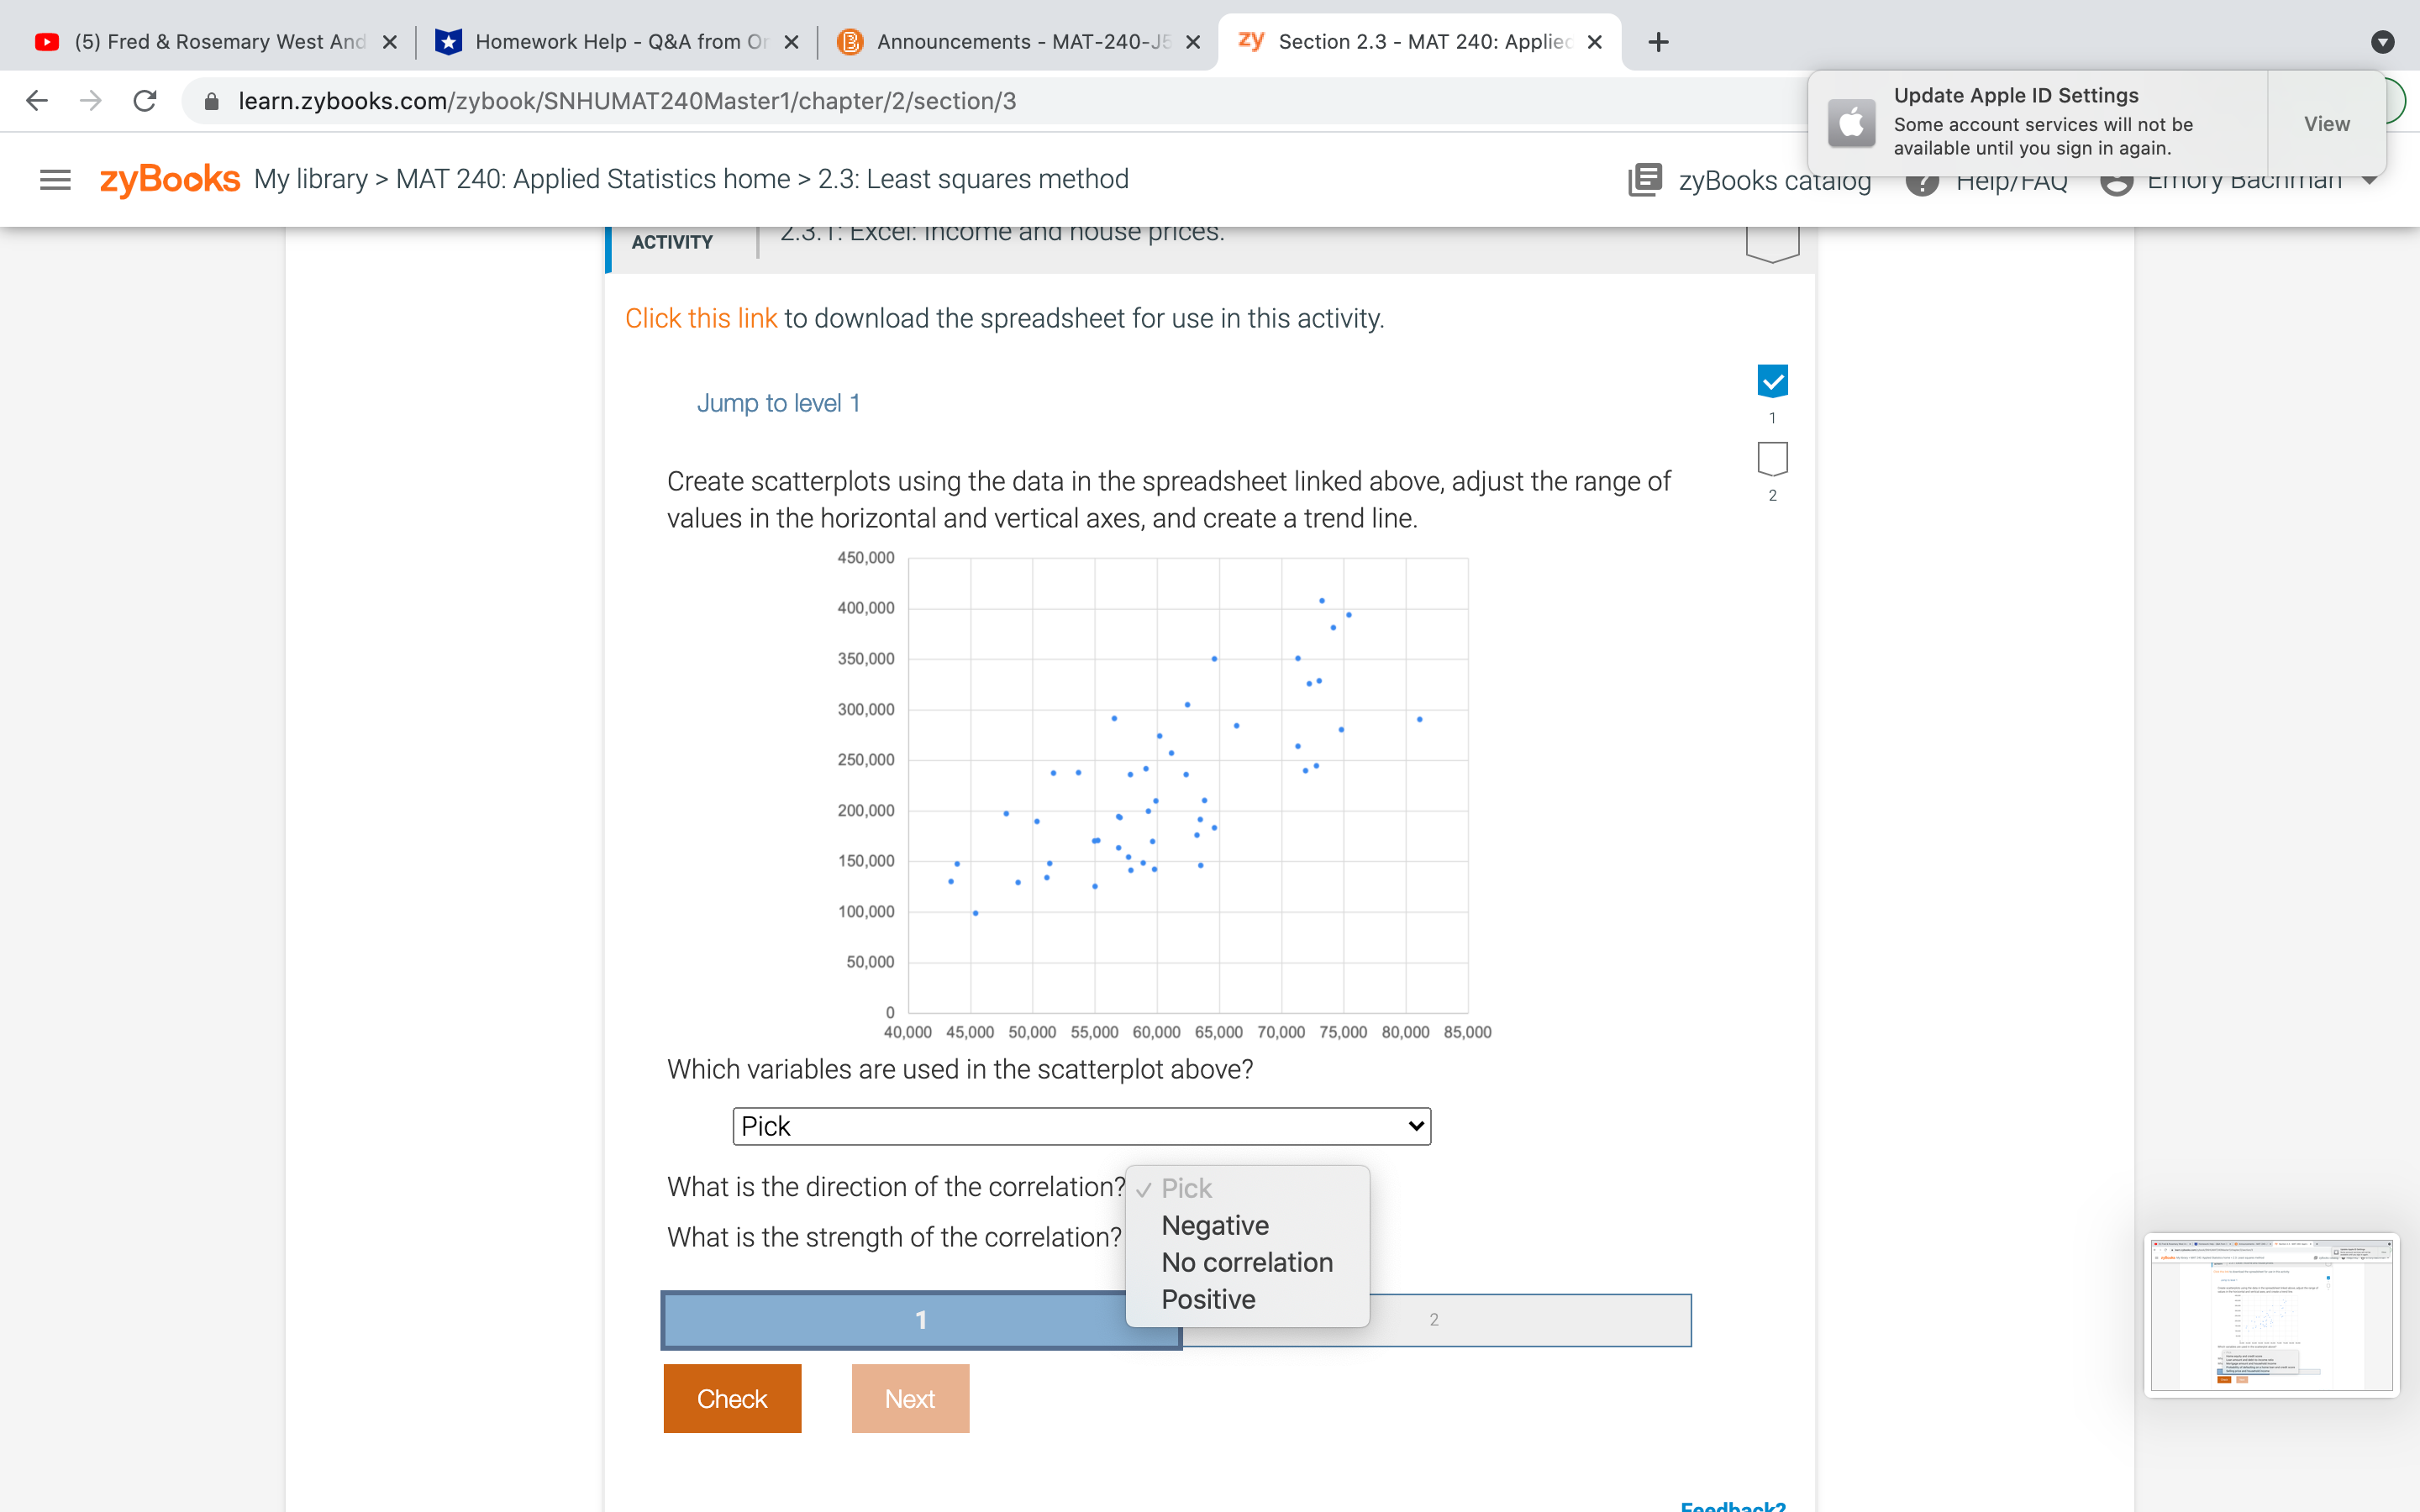
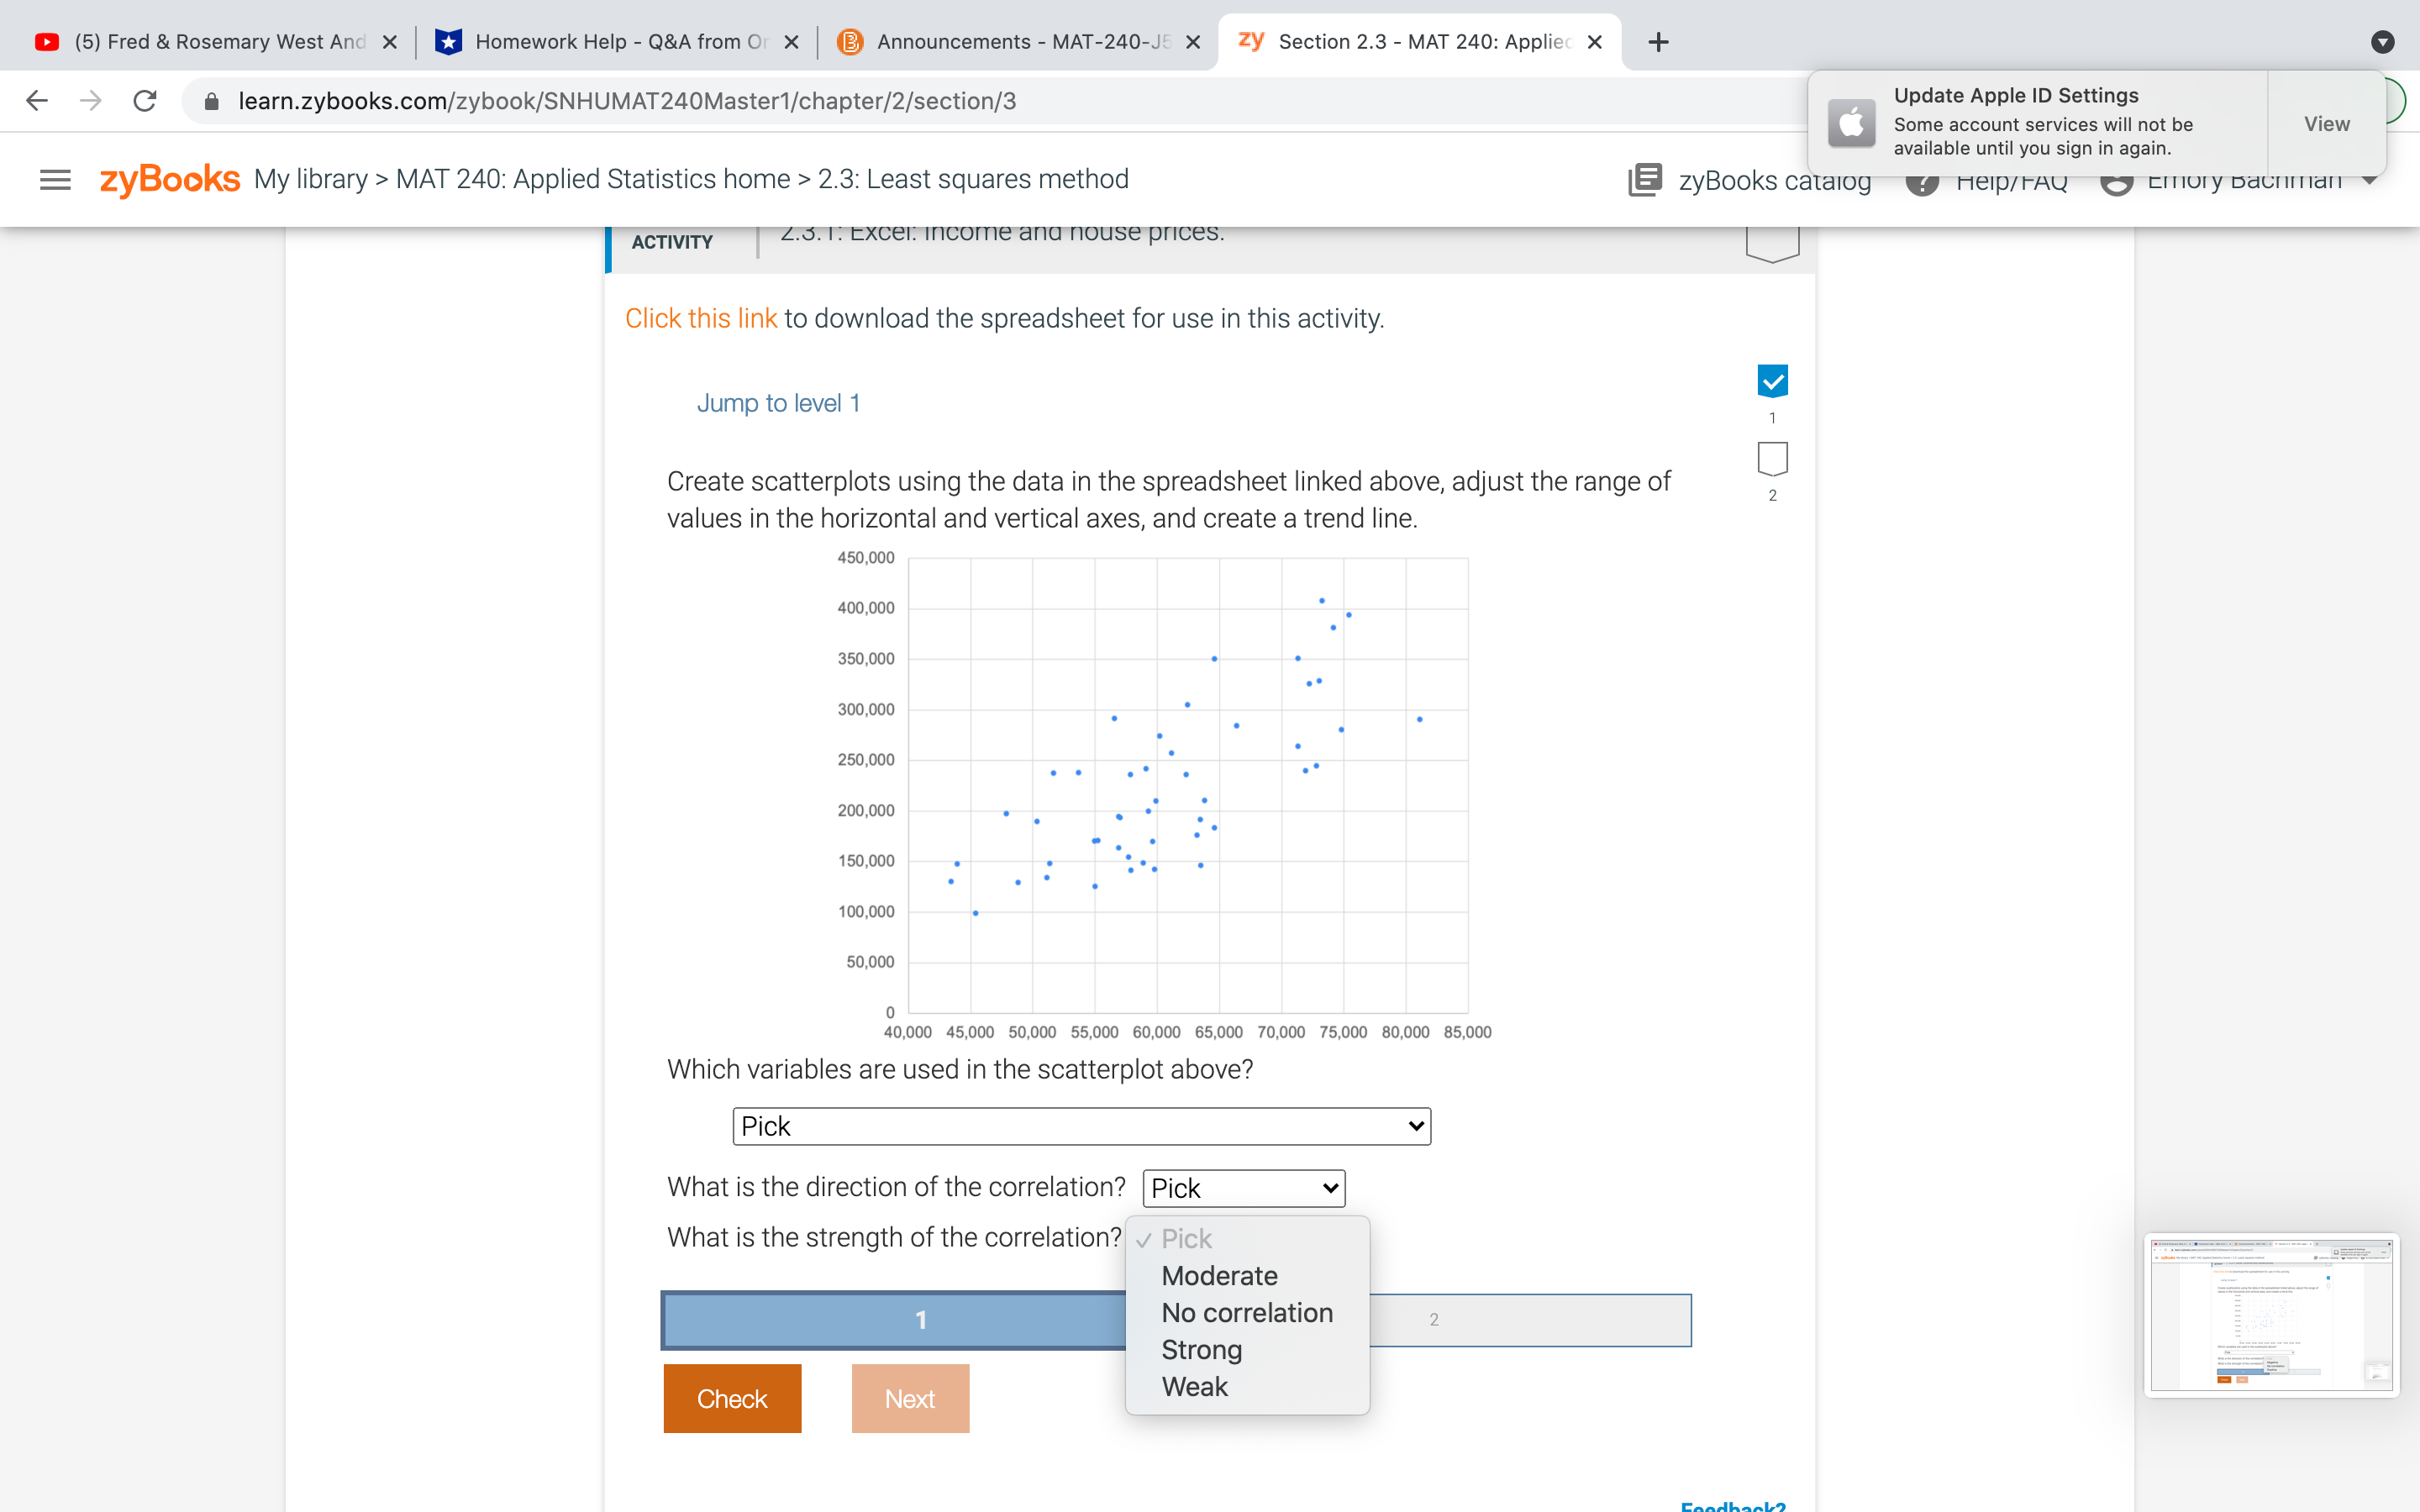
(5) Fred & Rosemary West And X Homework Help - Q&A from Or X B Announcements - MAT-240-J5 X zy Section 2.3 - MAT 240: Applied X + a learn.zybooks.com/zybook/SNHUMAT240Master1/chapter/2/section/3 Update Apple ID Settings Some account services will not be View available until you sign in again. =zyBooks My library > MAT 240: Applied Statistics home > 2.3: Least squares method zyBooks catalog Help/ FAQ CITIoly DaCHITTIan ACTIVITY 2.3. 1. Excel. Income and nouse prices. Click this link to download the spreadsheet for use in this activity. V Jump to level 1 1 Create scatterplots using the data in the spreadsheet linked above, adjust the range of 2 values in the horizontal and vertical axes, and create a trend line. 450,000 400,000 350,000 300,000 250,000 200,000 150,000 100,000 50,000 0 40,000 45,000 50,000 55,000 60,000 65,000 70,000 75,000 80,000 85,000 Which variables are used in the scatterplot above? Pick Home equity and credit score Wha Loan amount and debt-to-income ratio Wha Mortgage amount and household income Probability of defaulting on a home loan and credit score Selling price and household income Check Nexta (5) Fred & Rosemary West And X I u Homework Help - QM from Or x I @ Announcements - MAT-ZAO-JE > MAT 240: Applied Statistics home > 2.3: Least squares method E zyBooks ca ACTIVITY Click this link to download the spreadsheet for use in this activity. Jump to level 1 Create scatterplots using the data in the spreadsheet linked above, adjust the range of values in the horizontal and vertical axes, and create a trend line. 450.000 WEAK 400,000 . 350.000 . . 300.000 ' 250,000 ' . 200,000 . . 150,000 . . - . . 100,000 . 50.000 0 40.000 45.000 50.000 55.000 60.000 05.000 70.000 75.000 00.000 85.000 Which variables are used in the scatterplot above? Pick v What is the direction of the correlation/v Pick What is the strength of the correlation? Negative _ No correlation Positive e--a|..-m a (5) Fred & Rosemary West And X I u Homework Help - QM from Or x I @ Announcements - MAT-ZAO-JE > MAT 240: Applied Statistics home > 2.3: Least squares method E zyBooks ca ACTIVITY Click this link to download the spreadsheet for use in this activity. Jump to level 1 Create scatterplots using the data in the spreadsheet linked above, adjust the range of values in the horizontal and vertical axes, and create a trend line. 450.000 WEAK 400,000 . 350.000 . . 300.000 ' 250,000 ' . 200,000 . . 150,000 . . - . . 100,000 . 50.000 0 40.000 45.000 50.000 55.000 60.000 05.000 70.000 75.000 00.000 85.000 Which variables are used in the scatterplot above? Pick v What is the direction of the correlation? Pick v What is the strength of the correlation? v Pick Moderate No correlation Strong Weak e--a|..-m