i need help woth this. it is due tonight and i cant find the answer. the instructions are on page one, they wanted analysis of each lego color.
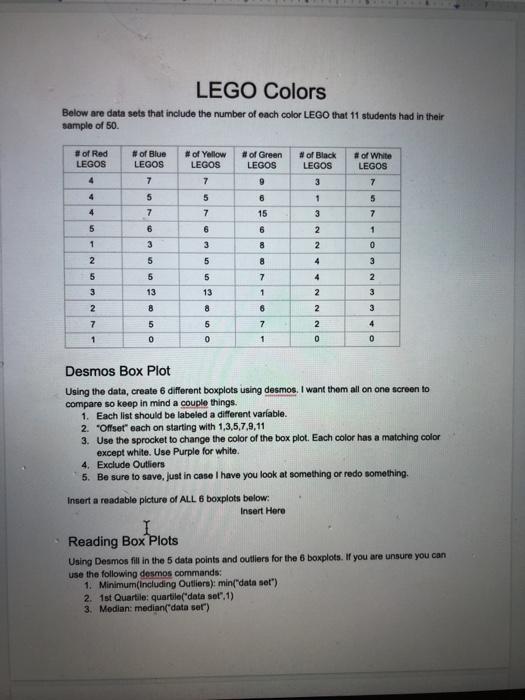
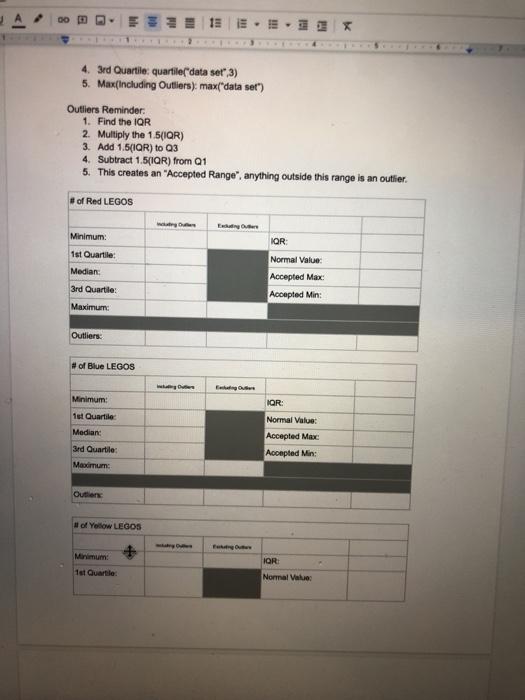
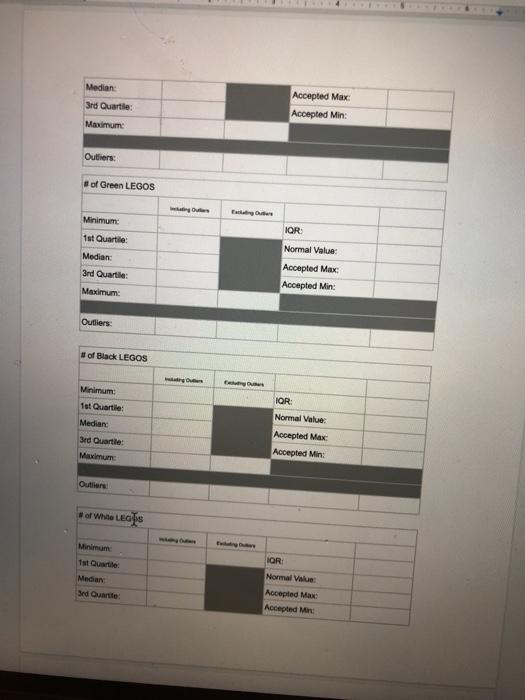
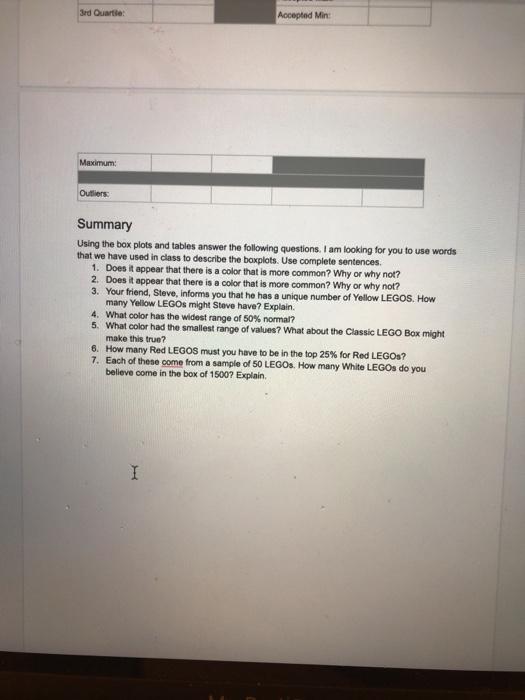
LEGO Colors Below are data sets that include the number of each color LEGO that 11 students had in their sample of 50. # of Red LEGOS 4 # of Blue LEGOS 7 # of Yellow LEGOS # of Green LEGOS 9 # of Black LEGOS # of White LEGOS 7 7 3 5 5 6 1 5 7 15 3 7 4 5 7 6 6 2 1 6 8 1 3 2 0 3 5 2 5 8 4 3 5 5 7 4 2 5 3 13 13 1 2 3 8 8 6 2 3 2 7 5 5 7 4 2 0 1 0 0 1 0 Desmos Box Plot Using the data, create 6 different boxplots using desmos. I want them all on one screen to compare so keep in mind a couple things. 1. Each list should be labeled a different variable. 2. "Offset each on starting with 1,3,5,7,9,11 3. Use the sprocket to change the color of the box plot. Each has a matching color except white. Use Purple for white. 4. Exclude Outliers 5. Be sure to save, just in case I have you look at something or redo something Insert a readable picture of ALL 6 boxplots below: Insert Here I Reading Box Plots Using Desmos fill in the 5 data points and outliers for the 6 boxplots. If you are unsure you can use the following desmos commands: 1. Minimum(Including Outliers): min("data set") 2. 1st Quartile: quartile("data set. 1) 3. Median: median(data set) 00 13 ... * 4. 3rd Quartile: quartile("data set",3) 5. Max(Including Outliers), max("data set") Outliers Reminder: 1. Find the IQR 2. Multiply the 1.5(QR) 3. Add 1.5(QR) to Q3 4. Subtract 1.5(QR) from Q1 5. This creates an "Accepted Range", anything outside this range is an outlier. #of Red LEGOS Eur Minimum IQR Normal Value: 1st Quartile: Median: 3rd Quartie: Maximum: Accepted Max Accepted Min: Outliers: # of Blue LEGOS Fahaa IOR Minimum: 1st Quartile Median: Normal Value Accepted Max Accepted Min: 3rd Quartile: Maximum: Oution of Yellow LEGOS + FO 1st Quarte IQR Normal Value Median: 3rd Quartie: Maximum Accepted Max Accepted Min: Outliers # of Green LEGOS IOR: Minimum 1st Quartile: Median 3rd Quartile: Normal Value: Accepted Max: Accepted Min: Maximum Outiers: of Black LEGOS IOR: Normal Value: Minimum 1st Quartile: Median 3rd Quartie: Modum Accepted Max Accepted Min: Outler of White LEGS Minimum Ist Quarte Median Sed Quartie IQR Normal Value Accepted Max Accepted Mir 3rd Quarte: Accepted Min: Maximum: Outliers: Summary Using the box plots and tables answer the following questions. I am looking for you to use words that we have used in class to describe the boxplots. Use complete sentences. 1. Does it appear that there is a color that is more common? Why or why not? 2. Does it appear that there is a color that is more common? Why or why not? 3. Your friend, Steve, informs you that he has a unique number of Yellow LEGOS. How many Yellow LEGOs might Steve have? Explain. 4. What color has the widest range of 50% normal? 5. What color had the smallest range of values? What about the Classic LEGO Box might make this true? 6. How many Red LEGOS must you have to be in the top 25% for Red LEGOS? 7. Each of these come from a sample of 50 LEGOs. How many White LEGOs do you belleve come in the box of 1500? Explain I LEGO Colors Below are data sets that include the number of each color LEGO that 11 students had in their sample of 50. # of Red LEGOS 4 # of Blue LEGOS 7 # of Yellow LEGOS # of Green LEGOS 9 # of Black LEGOS # of White LEGOS 7 7 3 5 5 6 1 5 7 15 3 7 4 5 7 6 6 2 1 6 8 1 3 2 0 3 5 2 5 8 4 3 5 5 7 4 2 5 3 13 13 1 2 3 8 8 6 2 3 2 7 5 5 7 4 2 0 1 0 0 1 0 Desmos Box Plot Using the data, create 6 different boxplots using desmos. I want them all on one screen to compare so keep in mind a couple things. 1. Each list should be labeled a different variable. 2. "Offset each on starting with 1,3,5,7,9,11 3. Use the sprocket to change the color of the box plot. Each has a matching color except white. Use Purple for white. 4. Exclude Outliers 5. Be sure to save, just in case I have you look at something or redo something Insert a readable picture of ALL 6 boxplots below: Insert Here I Reading Box Plots Using Desmos fill in the 5 data points and outliers for the 6 boxplots. If you are unsure you can use the following desmos commands: 1. Minimum(Including Outliers): min("data set") 2. 1st Quartile: quartile("data set. 1) 3. Median: median(data set) 00 13 ... * 4. 3rd Quartile: quartile("data set",3) 5. Max(Including Outliers), max("data set") Outliers Reminder: 1. Find the IQR 2. Multiply the 1.5(QR) 3. Add 1.5(QR) to Q3 4. Subtract 1.5(QR) from Q1 5. This creates an "Accepted Range", anything outside this range is an outlier. #of Red LEGOS Eur Minimum IQR Normal Value: 1st Quartile: Median: 3rd Quartie: Maximum: Accepted Max Accepted Min: Outliers: # of Blue LEGOS Fahaa IOR Minimum: 1st Quartile Median: Normal Value Accepted Max Accepted Min: 3rd Quartile: Maximum: Oution of Yellow LEGOS + FO 1st Quarte IQR Normal Value Median: 3rd Quartie: Maximum Accepted Max Accepted Min: Outliers # of Green LEGOS IOR: Minimum 1st Quartile: Median 3rd Quartile: Normal Value: Accepted Max: Accepted Min: Maximum Outiers: of Black LEGOS IOR: Normal Value: Minimum 1st Quartile: Median 3rd Quartie: Modum Accepted Max Accepted Min: Outler of White LEGS Minimum Ist Quarte Median Sed Quartie IQR Normal Value Accepted Max Accepted Mir 3rd Quarte: Accepted Min: Maximum: Outliers: Summary Using the box plots and tables answer the following questions. I am looking for you to use words that we have used in class to describe the boxplots. Use complete sentences. 1. Does it appear that there is a color that is more common? Why or why not? 2. Does it appear that there is a color that is more common? Why or why not? 3. Your friend, Steve, informs you that he has a unique number of Yellow LEGOS. How many Yellow LEGOs might Steve have? Explain. 4. What color has the widest range of 50% normal? 5. What color had the smallest range of values? What about the Classic LEGO Box might make this true? 6. How many Red LEGOS must you have to be in the top 25% for Red LEGOS? 7. Each of these come from a sample of 50 LEGOs. How many White LEGOs do you belleve come in the box of 1500? Explain