

Question
I need help writing the python code for the following three questions based on the output from above: 1) Create a visual of your choice
I need help writing the python code for the following three questions based on the output from above:
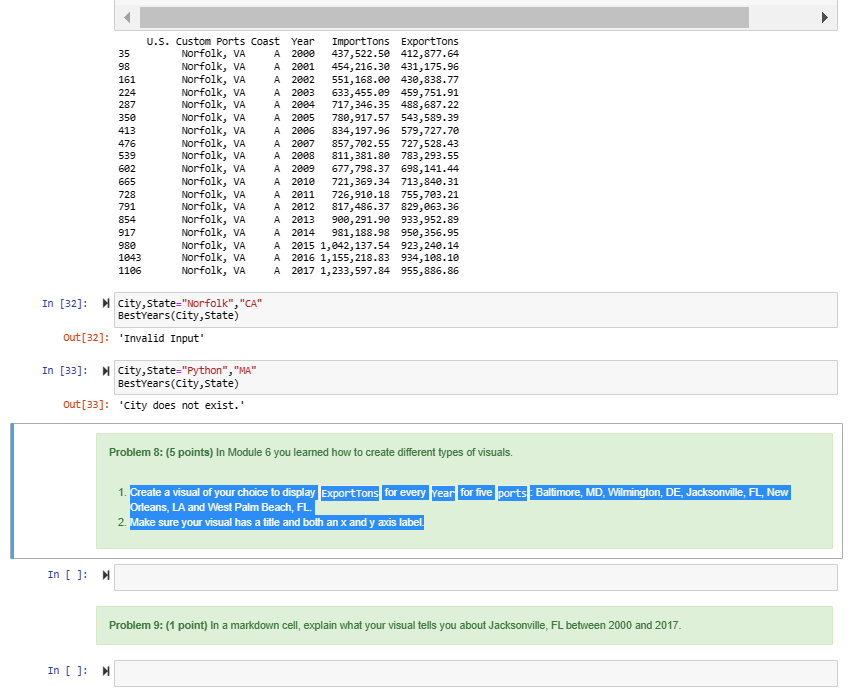
1) Create a visual of your choice to display ExportTons for every Year for five ports: Baltimore, MD, Wilmington, DE, Jacksonville, FL, New Orleans, LA and West Palm Beach, FL.
2) Make sure your visual has a title and both an x and y axis label.
Some options for the visual maps are heatmaps or seaborn pair plot.
3) In a markdown cell, explain what your visual tells you about Jacksonville, FL between 2000 and 2017.
See attachment:
Step by Step Solution
There are 3 Steps involved in it
Step: 1

Get Instant Access to Expert-Tailored Solutions
See step-by-step solutions with expert insights and AI powered tools for academic success
Step: 2

Step: 3
Ace Your Homework with AI
Get the answers you need in no time with our AI-driven, step-by-step assistance
Get Started
Databases In Networked Information Systems Second International Workshop Dnis 2002 Aizu Japan December 18 2002 Proceeding Lncs 2544
Authors: Subash Bhalla
1st Edition
3540002642, 978-3540002642