

Question
I need introduction, findings of horizontal analysis, findings of vertical analysis, findings of ratio analysis and conclusion based on that data. Please provide detailed information
 I need introduction, findings of horizontal analysis, findings of vertical analysis, findings of ratio analysis and conclusion based on that data. Please provide detailed information with about 700-900 words.
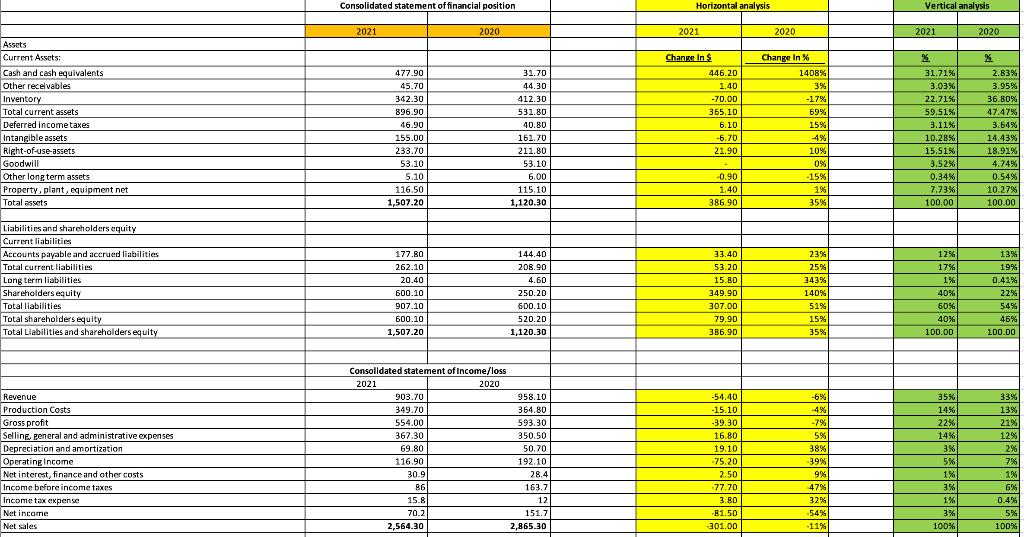
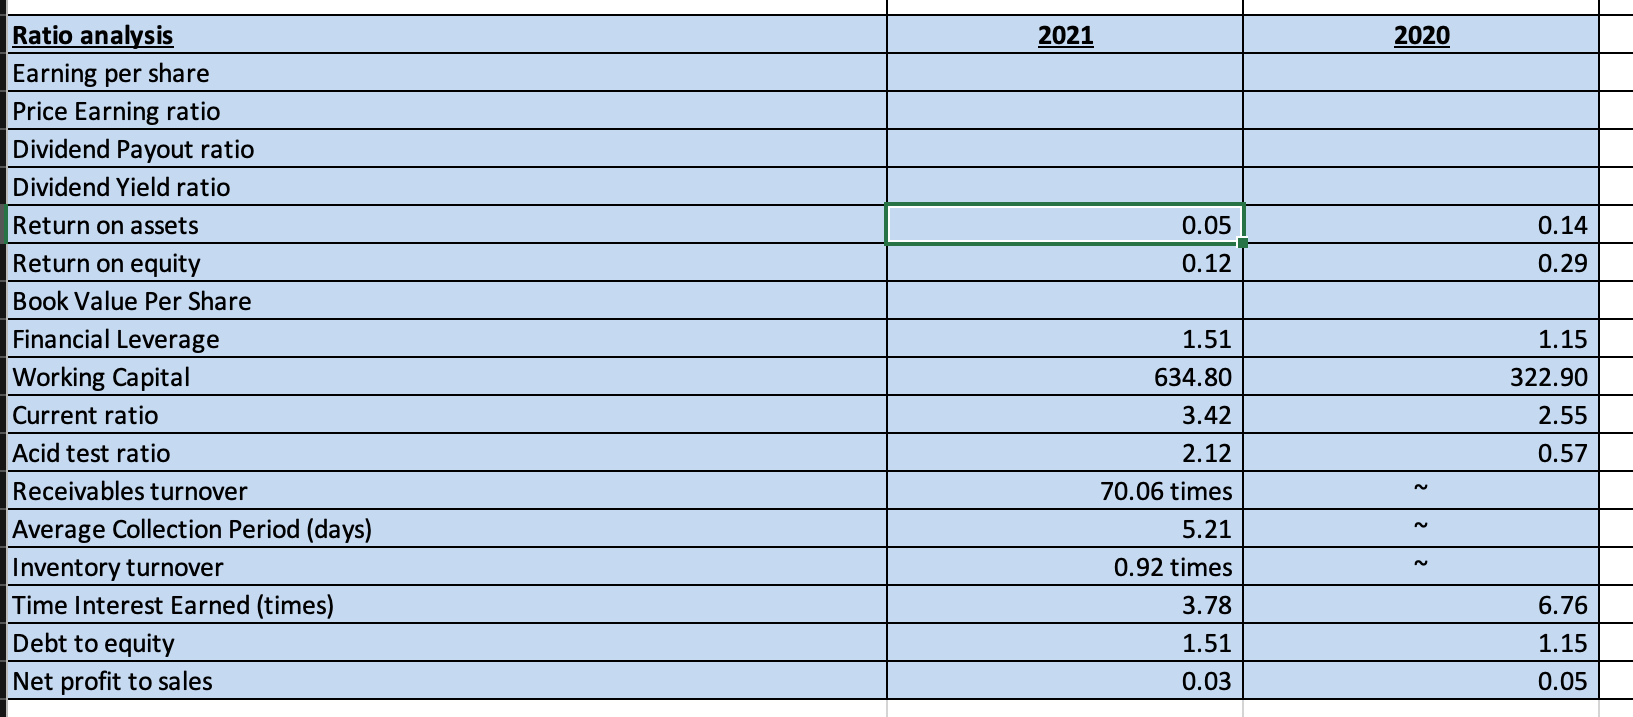
Consolidated statement of financial position Horizontal analysis Vertical analysis 2021 2020 2021 2020 2021 2020 Change in $ % 446,20 31.70 44.30 Assets Current Assets: Cash and cash equivalents Other receivables Inventory Total current assets Deferred income taxes Intangible assets Right-of-use-assets Goodwill Other long term assets Property, plant, equipment net Total assets 477.90 45.70 342.30 896.90 46.90 155.00 233.70 53.10 Change In % 1408% 3% -17% 69% 15% 1.40 -70.00 365.10 6.10 -6.70 21.90 412.30 531.80 40.80 161.70 211.80 53.10 6.00 115.10 1,120.30 31.71% 3.03% 22.71% 59.51% 3.11% 10.28% 15.51% 3.52% 0.34% 7.73% 100.00 % 2.83% 3.95% 36.80% 47.47% 3.64% 14.43% 18.91% 4.74% 0.54% 10.27% 100.00 5.10 10% 0% -15% 1% 35% -0.90 1.40 386.90 116.50 1,507.20 Liabilities and shareholders equity Current liabilities Accounts payable and accrued liabilities Total current liabilities Long term liabilities Shareholders equity Total liabilities Total shareholders equity Total Liabilities and shareholders equity 177.80 262.10 20.40 600.10 907.10 600.10 1,507.20 144.40 208.90 4.60 250.20 600.10 520.20 1,120.30 33.40 53.20 15.80 349.90 307.00 79.90 386.90 23% 25% 343% 140% 12% 17% 1% 40% 60% 40% 100.00 13% 19% 0.41% 22% 54% 46% 100.00 51% 15% 35% -6%. Revenue Production Costs Gross profit Selline general and administrative expenses Depreciation and amortization Operating Income Net interest, finance and other costs Income before income taxes Income tax expense Net income Net sales Consolidated statement of Income/loss 2021 2020 903.70 958.10 349.70 364.80 554.00 593.30 367.30 350.50 69.80 50.70 116.90 192.10 30.9 28.4 86 163.7 15.8 12 70.21 151.7 2,564.30 2,865.30 -54.40 -15.10 -39.30 16.80 19.10 -75.20 2.50 -77.70 3.80 -81.50 -301.00 -7% 5% 38% -39% 9% -47% 32% -54% -11% 35% 14% 22% 14% 3% % 5% 1% 3% 1% 3% 100% 33% 13% 21% 12% 2% 7% 1% 6% 0.4% 5% 100% 2021 2020 0.14 0.05 0.12 0.29 Ratio analysis Earning per share Price Earning ratio Dividend Payout ratio Dividend Yield ratio Return on assets Return on equity Book Value Per Share Financial Leverage Working Capital Current ratio Acid test ratio Receivables turnover Average Collection Period (days) Inventory turnover Time Interest Earned (times) Debt to equity Net profit to sales 1.51 634.80 1.15 322.90 2.55 0.57 3.42 22 2.12 70.06 times 5.21 0.92 times 3.78 1.51 6.76 1.15 0.03 0.05
Step by Step Solution
There are 3 Steps involved in it
Step: 1

Get Instant Access to Expert-Tailored Solutions
See step-by-step solutions with expert insights and AI powered tools for academic success
Step: 2

Step: 3
Ace Your Homework with AI
Get the answers you need in no time with our AI-driven, step-by-step assistance
Get Started
The Productivity Audit
Authors: Mark Spelman, Paul Spence
1st Edition
1907766073, 978-1907766077