Question
I need it to be done Using R Studio Data Collection and Processing Instructions You will scrape and analyzing data dealing with snowfall statistics. The
I need it to be done Using R Studio
Data Collection and Processing
Instructions
You will scrape and analyzing data dealing with snowfall statistics. The steps outlined in this document should be completed in sequential order since some steps rely on the completion of previous steps. To complete this part, you are welcome to use any resource available to you except for other students.
An R coding template is provided on Blackboard. You must insert your code for each steps under the commented section of the template. You will turn in your code through Blackboard as a plain text file. For this part, extensively commenting your code is NOT necessary. Focus on finishing all steps.
Dataset
The dataset for this assignment is currently loaded to: http://pentland-res-
01.boisestate.edu/sample_data/data_table.html. This dataset provides daily snowfall information for two ski resorts (Telluride and Jackson Hole). The data contains 5 columns: location, date, daily_snowfall, season_snowfall_total, base_depth.
Bailout Dataset
In the event that you are unable to complete a step necessary for subsequent steps, I have provided an Excel document that contains the data at various stages. The Excel document can be found on Blackboard and contains the following sheets:
- 1_Snowfall Data
- 2_Clean Snowfall Data
- 3_Clean Snowfall Data Date
- 4_Clean Snowfall Data w year
- 5_Telluride Avg Yearly Snow
Each question identifies what data in the bailout file are produced or what data should be used to complete the problem. You will only need to use the bailout data if you are unable to complete a previous step. You can use the xlsx library in R to read the Excel document and specific sheets. For example, the code below reads the sheet called 1_Snowfall Data from the file. Be sure to set your working directory to the proper location before trying to read the file:
library(xlsx)
df
You will not necessarily lose points for using this dataset, but you will have points deducted for not being able to complete each step.
Step 1 (Points 11). Using the rvest library and techniques discussed in class, scrape the snowfall data from http://pentland-res-01.boisestate.edu/sample_data/data_table.html and save it to R as a data frame with the following headings: location, date, daily_snowfall, season_snowfall_total, base_depth. Name your data frame df.
The data produced from this step can be found on sheet: 1_Snowfall Data
Step 2. (Points 11) Create a function that can clean the following columns: daily_snowfall, season_snowfall_total, and base_depth. Each of these columns contain the same type of errors: extra white spaces and numbers that arent numbers (cm included with number). Your function should receive a vector or column of data (e.g. daily_snowfall, season_snowfall_total, and base_depth), clean the data, and then return the data as numbers ready for analysis. Your function will need to use gsub(), trimws(), and as.numeric() in order to remove cm from the data, clean extra whitespaces, and convert to a number.
Step 3. (Points 5) Use the function from Step 3 to clean the following variables: daily_snowfall, season_snowfall_total, and base_depth.
The data produced from this step can be found on sheet: 2_Clean Snowfall Data
Step 4. (Points 4) Format the date so that it is readable to R. To do this, use the as.Date() function with the format parameter equal to: %m/%d/%Y
See https://www.rdocumentation.org/packages/base/versions/3.6.2/topics/as.Date for information on the as.Date() function.
The data produced from this step can be found on sheet: 3_Clean Snowfall Data Date. However, if reading this data into R from the bailout file, you may still need to convert the date to a date object in R using df$date
Excel Data

.TXT File
########################################### ########### Assignment 5 ################# ###########################################
#### Step 1. Scrape Data from website ####
#### Step 2. Create a cleaning function####
#### Step 3. Apply Cleaning Function ####
#### Step 4. Format date ####
#### Step 5. Calculate Max Daily Snowfall for each location #####
#### Step 6. Calculate Average daily snowfall year by year for Telluride ####
#### Step 7. Plot average daily snowfall by year for Telluride ####
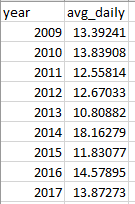
year avg_daily 2009 13.39241 2010 13.83908 2011 12.55814 2012 12.67033 2013 10.80882 2014 18.16279 2015 11.83077 2016 14.57895 2017 13.87273 year avg_daily 2009 13.39241 2010 13.83908 2011 12.55814 2012 12.67033 2013 10.80882 2014 18.16279 2015 11.83077 2016 14.57895 2017 13.87273Step by Step Solution
There are 3 Steps involved in it
Step: 1

Get Instant Access to Expert-Tailored Solutions
See step-by-step solutions with expert insights and AI powered tools for academic success
Step: 2

Step: 3

Ace Your Homework with AI
Get the answers you need in no time with our AI-driven, step-by-step assistance
Get Started


