I need screen shot STEP BY STEP
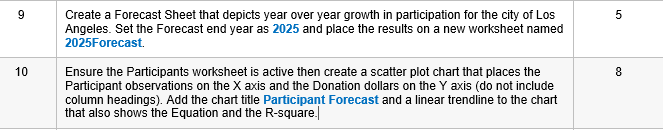
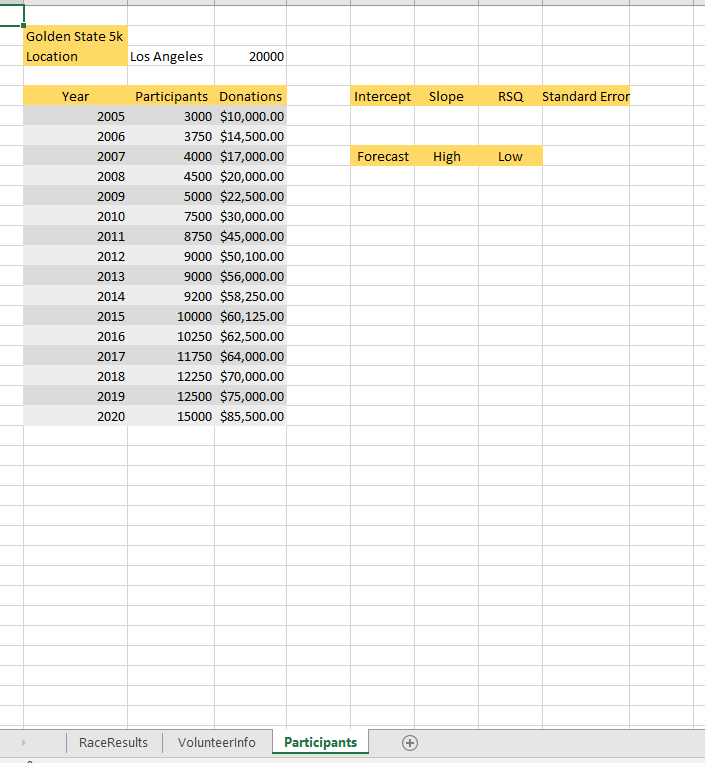
9 Create a Forecast Sheet that depicts year over year growth in participation for the city of Los Angeles. Set the Forecast end year as 2025 and place the results on a new worksheet named 2025Forecast. 10 Ensure the Participants worksheet is active then create a scatter plot chart that places the Participant observations on the X axis and the Donation dollars on the Y axis (do not include column headings). Add the chart title Participant Forecast and a linear trendline to the chart that also shows the Equation and the R-square. 5 8 Golden State 5k Runner # Age 8806 3092 6756 3768 6062 4746 3503 8113 2913 8526 9205 1897 3569 7294 3428 3299 4022 2987 9309 5215 8683 4305 5796 6689 4673 8613 9469 1936 5436 4752 2398 6065 1957 Duration Frequency 0:14:24 2 0:28:48 18 0:43:12 23 0:57:36 27 39 1:12:00 1:26:24 40 18 0 21 3 30 12 40 1 50 3 60 0 >60 More 0 Correlatior Covariance Variance Standard Deviation 0.5156517 0.152767 266.735 16.33201439 Participants + Time 20 0:18:43 20 0:16:34 21 0:28:48 22 0:14:24 22 0:57:36 22 0:27:22 23 0:22:19 23 0:28:48 24 0:17:17 25 0:22:19 27 0:27:22 27 0:50:52 28 0:25:38 28 0:17:43 29 0:16:34 36 0:43:12 43 0:57:36 44 1:01:12 44 0:19:03 46 1:01:12 47 1:04:48 47 0:35:17 47 1:03:22 48 0:19:03 49 1:04:48 49 1:04:48 51 0:33:24 51 1:04:48 55 1:37:12 55 1:04:48 55 1:04:48 56 0:48:58 57 1.01.19 RaceResults Volunteerinfo Age Bin 18 21 30 40 50 60 Frequency umulative % 0.00% 15.79% 78.95% 84.21% 100.00% 100.00% 100.00% 15 10 A 0 18 Bin Histogram More 150.00% 100.00% 50.00% 0.00% Frequency -Cumulative % Golden State 5k Location Year 2005 2006 2007 2008 2009 2010 2011 2012 2013 2014 2015 2016 2017 2018 2019 2020 RaceResults PPL Combined Los Angeles San Diego 3,000 2,250 3,750 2,375 4,000 2,400 4,500 3,200 5,000 3,175 7,500 4,000 8,750 4,500 9,000 5,000 9,000 5,210 9,200 5,500 10,000 6,000 10,250 6,025 11,750 6,250 12,250 6,800 12,500 7,000 15,000 7,800 Volunteerinfo Participants San Jose 2,000 2,200 2,500 3,000 3,025 4,500 5,000 5,480 6,000 6,200 6,500 7,000 7,100 7,500 7,800 8,000 (+) Anova: Single Factor SUMMARY Los Angeles San Diego San Jose ANOVA Source of Variation Between Groups Within Groups Total Groups Count 16 16 16 SS 1.26E+08 3.06E+08 4.32E+08 Sum Average Variance 135450 8465.625 12768906.25 77485 4842.8125 3175043.229 83805 5237.8125 4450409.896 df F P-value F crit MS 2 63198850.5 9.296519105 0.000417 3.204317 45 6798119.79 47 Golden State 5k Location Year Los Angeles 20000 Participants Donations 3000 $10,000.00 3750 $14,500.00 4000 $17,000.00 4500 $20,000.00 5000 $22,500.00 7500 $30,000.00 8750 $45,000.00 9000 $50,100.00 9000 $56,000.00 9200 $58,250.00 10000 $60,125.00 10250 $62,500.00 11750 $64,000.00 12250 $70,000.00 12500 $75,000.00 15000 $85,500.00 Volunteerinfo Participants 2005 2006 2007 2008 2009 2010 2011 2012 2013 2014 2015 2016 2017 2018 2019 2020 RaceResults Intercept Slope Forecast High RSQ Low Standard Error 9 Create a Forecast Sheet that depicts year over year growth in participation for the city of Los Angeles. Set the Forecast end year as 2025 and place the results on a new worksheet named 2025Forecast. 10 Ensure the Participants worksheet is active then create a scatter plot chart that places the Participant observations on the X axis and the Donation dollars on the Y axis (do not include column headings). Add the chart title Participant Forecast and a linear trendline to the chart that also shows the Equation and the R-square. 5 8 Golden State 5k Runner # Age 8806 3092 6756 3768 6062 4746 3503 8113 2913 8526 9205 1897 3569 7294 3428 3299 4022 2987 9309 5215 8683 4305 5796 6689 4673 8613 9469 1936 5436 4752 2398 6065 1957 Duration Frequency 0:14:24 2 0:28:48 18 0:43:12 23 0:57:36 27 39 1:12:00 1:26:24 40 18 0 21 3 30 12 40 1 50 3 60 0 >60 More 0 Correlatior Covariance Variance Standard Deviation 0.5156517 0.152767 266.735 16.33201439 Participants + Time 20 0:18:43 20 0:16:34 21 0:28:48 22 0:14:24 22 0:57:36 22 0:27:22 23 0:22:19 23 0:28:48 24 0:17:17 25 0:22:19 27 0:27:22 27 0:50:52 28 0:25:38 28 0:17:43 29 0:16:34 36 0:43:12 43 0:57:36 44 1:01:12 44 0:19:03 46 1:01:12 47 1:04:48 47 0:35:17 47 1:03:22 48 0:19:03 49 1:04:48 49 1:04:48 51 0:33:24 51 1:04:48 55 1:37:12 55 1:04:48 55 1:04:48 56 0:48:58 57 1.01.19 RaceResults Volunteerinfo Age Bin 18 21 30 40 50 60 Frequency umulative % 0.00% 15.79% 78.95% 84.21% 100.00% 100.00% 100.00% 15 10 A 0 18 Bin Histogram More 150.00% 100.00% 50.00% 0.00% Frequency -Cumulative % Golden State 5k Location Year 2005 2006 2007 2008 2009 2010 2011 2012 2013 2014 2015 2016 2017 2018 2019 2020 RaceResults PPL Combined Los Angeles San Diego 3,000 2,250 3,750 2,375 4,000 2,400 4,500 3,200 5,000 3,175 7,500 4,000 8,750 4,500 9,000 5,000 9,000 5,210 9,200 5,500 10,000 6,000 10,250 6,025 11,750 6,250 12,250 6,800 12,500 7,000 15,000 7,800 Volunteerinfo Participants San Jose 2,000 2,200 2,500 3,000 3,025 4,500 5,000 5,480 6,000 6,200 6,500 7,000 7,100 7,500 7,800 8,000 (+) Anova: Single Factor SUMMARY Los Angeles San Diego San Jose ANOVA Source of Variation Between Groups Within Groups Total Groups Count 16 16 16 SS 1.26E+08 3.06E+08 4.32E+08 Sum Average Variance 135450 8465.625 12768906.25 77485 4842.8125 3175043.229 83805 5237.8125 4450409.896 df F P-value F crit MS 2 63198850.5 9.296519105 0.000417 3.204317 45 6798119.79 47 Golden State 5k Location Year Los Angeles 20000 Participants Donations 3000 $10,000.00 3750 $14,500.00 4000 $17,000.00 4500 $20,000.00 5000 $22,500.00 7500 $30,000.00 8750 $45,000.00 9000 $50,100.00 9000 $56,000.00 9200 $58,250.00 10000 $60,125.00 10250 $62,500.00 11750 $64,000.00 12250 $70,000.00 12500 $75,000.00 15000 $85,500.00 Volunteerinfo Participants 2005 2006 2007 2008 2009 2010 2011 2012 2013 2014 2015 2016 2017 2018 2019 2020 RaceResults Intercept Slope Forecast High RSQ Low Standard Error