

Answered step by step
Verified Expert Solution
Question
1 Approved Answer
I need some help. 1. Determine the poles of the transfer function G(s) for the values of and n in Table 1 . 2. Calculate
I need some help. 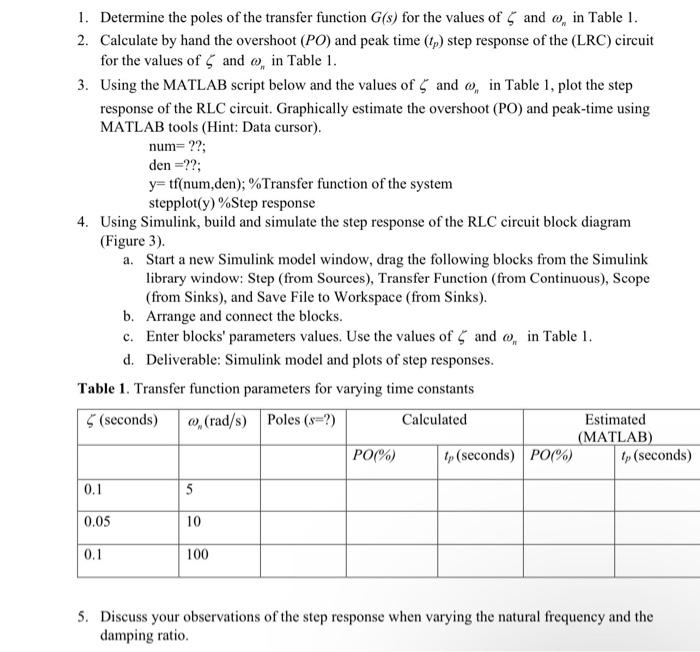
1. Determine the poles of the transfer function G(s) for the values of and n in Table 1 . 2. Calculate by hand the overshoot (PO) and peak time (tp) step response of the (LRC) circuit for the values of and n in Table 1. 3. Using the MATLAB script below and the values of and n in Table 1, plot the step response of the RLC circuit. Graphically estimate the overshoot (PO) and peak-time using MATLAB tools (Hint: Data cursor). num=??;den=??;y=tf(num,den);%Transferfunctionofthesystemstepplot(y)%Stepresponse 4. Using Simulink, build and simulate the step response of the RLC circuit block diagram (Figure 3). a. Start a new Simulink model window, drag the following blocks from the Simulink library window: Step (from Sources), Transfer Function (from Continuous), Scope (from Sinks), and Save File to Workspace (from Sinks). b. Arrange and connect the blocks. c. Enter blocks' parameters values. Use the values of and n in Table 1 . d. Deliverable: Simulink model and plots of step responses. Table 1. Transfer function parameters for varying time constants 5. Discuss your observations of the step response when varying the natural frequency and the damping ratio Step by Step Solution
There are 3 Steps involved in it
Step: 1

Get Instant Access to Expert-Tailored Solutions
See step-by-step solutions with expert insights and AI powered tools for academic success
Step: 2

Step: 3
Ace Your Homework with AI
Get the answers you need in no time with our AI-driven, step-by-step assistance
Get Started
Privacy In Statistical Databases Unesco Chair In Data Privacy International Conference Psd 2014 Ibiza Spain September 17 19 2014 Proceedings Lncs 8744
Authors: Josep Domingo-Ferrer
2014th Edition
3319112562, 978-3319112565