Answered step by step
Verified Expert Solution
Question
1 Approved Answer
I need some help on how this works in Excel. I have no prior Excel knowledge. The data can be made up, or just an

I need some help on how this works in Excel. I have no prior Excel knowledge. The data can be made up, or just an example of how this should work. I really appreciate the guidance.
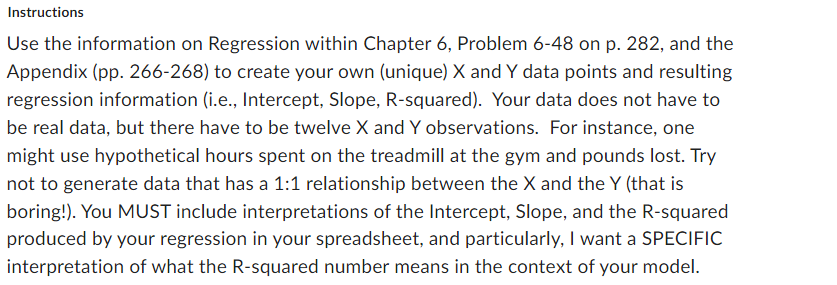
Instructions Use the information on Regression within Chapter 6, Problem 6-48 on p. 282, and the Appendix (pp. 266-268) to create your own (unique) X and Y data points and resulting regression information (i.e., Intercept, Slope, R-squared). Your data does not have to be real data, but there have to be twelve X and Y observations. For instance, one might use hypothetical hours spent on the treadmill at the gym and pounds lost. Try not to generate data that has a 1:1 relationship between the X and the Y (that is boring!). You MUST include interpretations of the Intercept, Slope, and the R-squared produced by your regression in your spreadsheet, and particularly, I want a SPECIFIC interpretation of what the R-squared number means in the context of your modelStep by Step Solution
There are 3 Steps involved in it
Step: 1

Get Instant Access to Expert-Tailored Solutions
See step-by-step solutions with expert insights and AI powered tools for academic success
Step: 2

Step: 3

Ace Your Homework with AI
Get the answers you need in no time with our AI-driven, step-by-step assistance
Get Started


