I need some help with coding this python project. In this question, I have joined two tables using countries shorten abbreviation in their (geo) columns. Now I need to keep only those rows where (time)=(time_2). 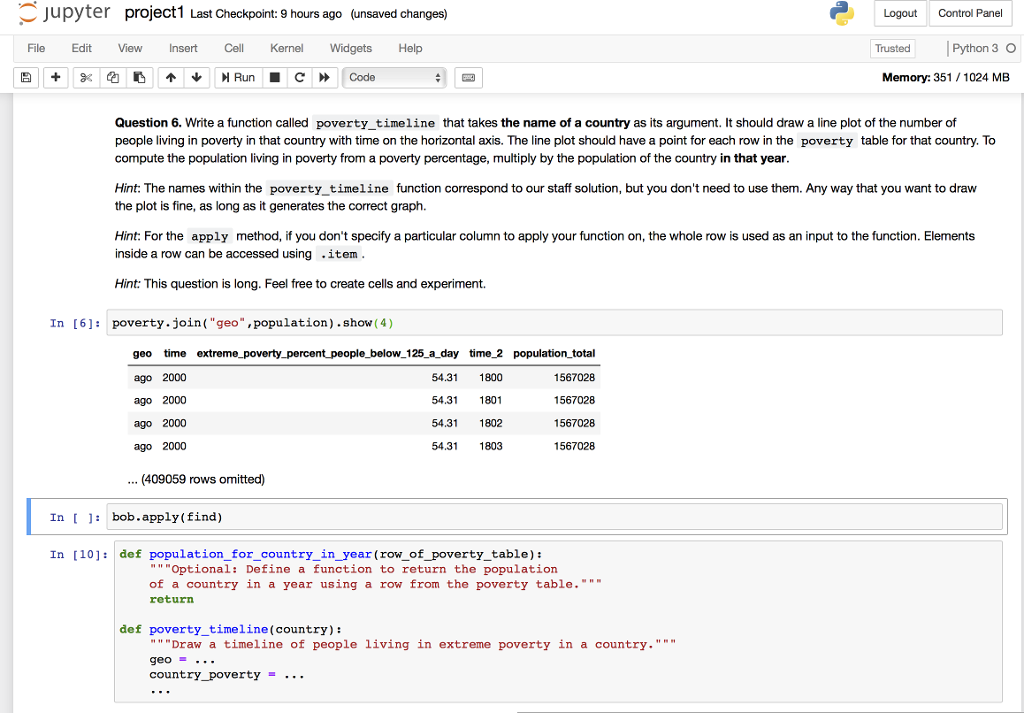
jupyter project1 Last Checkpoint:9 hours ago (unsaved changes) Logout Control Panel File Edit View Insert Cell Kernel Widgets Help Trusted Python 3 O Memory: 351 /1024 MB Question 6. Write a function called poverty timeline that takes the name of a country as its argument. It should draw a line plot of the number of people ng in poverty in that country with time on the horizontal axis. The line plot should have a point for each row in the poverty table for that country. To compute the population living in poverty from a poverty percentage, multiply by the population of the country in that year Hint: The names within the poverty_ timeline function correspond to our staff solution, but you don't need to use them. Any way that you want to draw the plot is fine, as long as it generates the correct graph. Hint: For the apply method, if you don't specify a particular column to apply your function on, the whole row is used as an input to the function. Elements inside a row can be accessed using .item Hint: This question is long. Feel free to create cells and experiment. In [6]: poverty.join"geo" population).show (4) geo time extreme_poverty percent people_below 125 a day time_2 population total ago 2000 ago 2000 ago 2000 ago 2000 54.31 1800 54.31 1801 54.31 1802 54.31 1803 1567028 1567028 1567028 1567028 (409059 rows omitted) In [: bob.apply(find) In [101: def population_for_country_ in_year (row_of_poverty table): "" "Optional: Define a function to return the population of a country in a year using a row from the poverty table.""* return def poverty timeline(country): "Draw a timeline of people living in extreme poverty in a country.""" geo .. country_poverty... jupyter project1 Last Checkpoint:9 hours ago (unsaved changes) Logout Control Panel File Edit View Insert Cell Kernel Widgets Help Trusted Python 3 O Memory: 351 /1024 MB Question 6. Write a function called poverty timeline that takes the name of a country as its argument. It should draw a line plot of the number of people ng in poverty in that country with time on the horizontal axis. The line plot should have a point for each row in the poverty table for that country. To compute the population living in poverty from a poverty percentage, multiply by the population of the country in that year Hint: The names within the poverty_ timeline function correspond to our staff solution, but you don't need to use them. Any way that you want to draw the plot is fine, as long as it generates the correct graph. Hint: For the apply method, if you don't specify a particular column to apply your function on, the whole row is used as an input to the function. Elements inside a row can be accessed using .item Hint: This question is long. Feel free to create cells and experiment. In [6]: poverty.join"geo" population).show (4) geo time extreme_poverty percent people_below 125 a day time_2 population total ago 2000 ago 2000 ago 2000 ago 2000 54.31 1800 54.31 1801 54.31 1802 54.31 1803 1567028 1567028 1567028 1567028 (409059 rows omitted) In [: bob.apply(find) In [101: def population_for_country_ in_year (row_of_poverty table): "" "Optional: Define a function to return the population of a country in a year using a row from the poverty table.""* return def poverty timeline(country): "Draw a timeline of people living in extreme poverty in a country.""" geo .. country_poverty